Buildings, Systems and Data

Designing a building or a city block is a process that involves many different players representing different professions working in concert to produce a design that is ultimately realized. This coalition of professions, widely referred to as AECO (Architecture, Engineering, Construction and Operation) or AEC industry, is a diverse industry with each element of the process representing a different means of approaching, understanding, and addressing the problem of building design.
As with many, the AECO industry is also embracing digital transformation and has begun to shift towards more collaborative, integrated, and multi-disciplinary teams that seek to make use of data as a part of the practice of building design and construction.
This transformation promises to give project managers which can include architects, engineers, contractors, and owners the ability to take advantage of analytics to create data-informed decisions. This is a way of decreasing the time between design iterations, improving the quality and performance of buildings, and providing transparency in the design process as a means of reassuring owners and key stakeholders to the value of a design move.
The digital transformation of AECO is making use of more integrated teams and systems but is impeded by the, well documented, necessity of exchanging data between the specialized software and the difficulty of doing so. This has meant that teams focus less on using data to make designs better and spend more time on tasks that do not add value to the product, such as re-producing their models, for the purposes of making them compatible with proprietary software, such as the ones used for energy modeling.
The specialized software in use was never developed with the intention of facilitating collaboration, rather to aid specialists in providing consultation. This has led the AECO to have models and the data they contain, become siloed and completely cut off, making it difficult to realize the benefits of any digital transformation.
What is discussed here, are the current challenges present currently present, along with the opportunities presented by the transformation of prevailing methods of data management and representation to make use of knowledge graphs to mobilize data across the multiple silos involved in the design of the built environment.
Building Information Modeling
Before discussing the role knowledge graphs play in AECO’s transformation, or the difficulties presented, it is important to understand how a building is modeled for the purposes of design, construction, and operation. Building Information Modeling (BIM) represents the most advanced form of data management in use in the practice of building design, with programs such as Autodesk Revit having captured significant market share.
BIM is a concept, or methodology, that encapsulates domain-relevant expert knowledge and is a digital representation of the physical and functional characteristics of a building. BIM is, in essence, an object oriented 3D modeling environment that captures much of the basic terminology and rules of architecture in a single package. BIM data provides users access to a significant number of semantics, constraints, and important relationships concerning common building elements (e.g., wall, floor, roof etc.). The use of BIM software also allows project teams to associate certain kinds of data with elements (e.g., materials) which are critical when considering sustainability or cost estimates in building components.
BIM has become the most suitable platform to operationalize data about buildings and move beyond 2D drawings, CAD and 3D representations which make visualization of a project difficult. The BIM process provides an existing semantic context found in professional practice, such as common concepts of fundamental building project elements, for instance walls, floors, roofs etc., as well as a way of storing data about those elements on a per element basis.
This approach allows objects to be easily defined and represented in a consistent manner and for the lifecycle of the construction project. However, this approach has created a system that defines objects in a very rigid way which is difficult to adapt as a project’s context changes with a new collaborative process or the discovery of special conditions. In essence, BIM is a model that can serve as a cradle to grave database concerning the building, its systems, and components. BIM technology is a powerful concept and provides a consistent set of semantics, constraints and relationships drawn from professional practice that ought to serve as a starting point for any BIM project. The digitalization of AECO should take full advantage of the automation, functionality, and semantic context of BIM and, instead of recreating it, extend it to be a central part of the way data are accessed and interfaced with during the building design process.
The Three Hurdles of Data in AECO
Digital transformation in the context of AECO presents a unique set of barriers that prevent the industry from fully realizing the benefits it desires from this ongoing process. We can conceive of there being three major hurdles that, if overcome, will take AECO a significant part of the way towards achieving the goals it has set for itself. These hurdles are:
How do we consistently represent concepts between software?
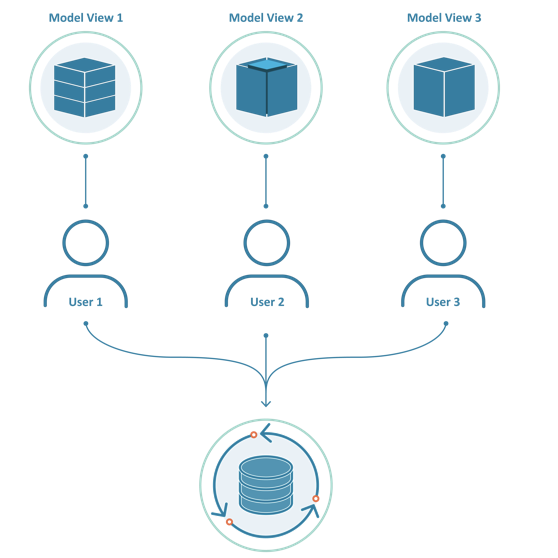
The specialized software of AECO, necessary for each discipline’s specific needs, has become a barrier to this general inclination towards increased integration within teams, as the ways certain concepts are captured and modeled can vary widely between disciplines. For example, an architectural wall is solid geometry together with data about construction and cladding materials, however to an environmental engineer a wall is a mathematical surface that embodies data concerning heat transfer properties. While it is possible to generate the engineering model from the architectural one, due to many limitations it is not possible to easily exchange these data back to the architect as easily.
What can a knowledge graph do to make BIM more consistent, ensuring that concepts are consistently represented across environments?
The role a knowledge graph plays is to extend BIM past a mono-semantic representation that requires a model to be segmented by discipline. This allows for knowledge to be exchanged as a part of the modeling process. This makes the BIM model a heterogeneous linked system hypermodel that supports multiple disciplines and their own working practices.
How do we ensure that data represent what they assert to be?
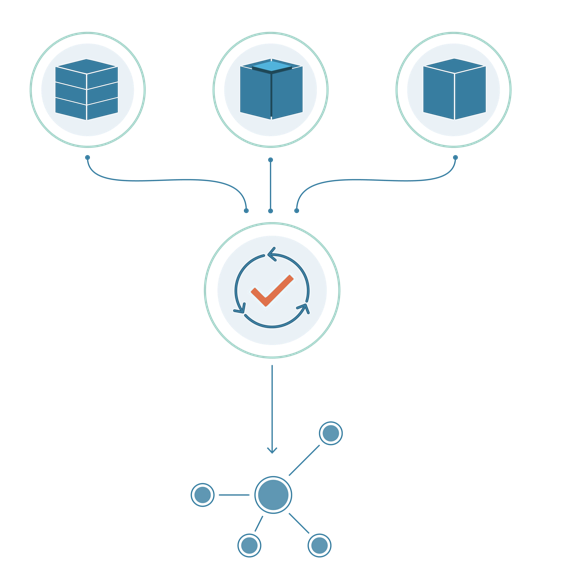
While BIM provides semantics that seek to ensure that models are consistent, individual instances of BIM applications have been designed with enough flexibility that users are able to assign semantics to custom objects. It is possible, and not uncommon, for elements to be assigned incorrectly or to have the correct assignment overwritten. These objects that violate the semantic can cause problems for processes that consume data from the BIM model and are a leading cause of inefficiency in data exchanges currently.
What is the role of a knowledge graph in providing validation, to ensure that data moving from environment to environment are not only consistent, but accurate?
A knowledge graph creates a means of providing quality control for data as an object is inserted in the model. Using Stardog’s native support for the Shape Constraint Language (SHACL) allows data to be modeled with a robust set of constraints that ensure that a new object represents a valid instance for all represented stakeholders.
How do we retrieve only what is necessary?
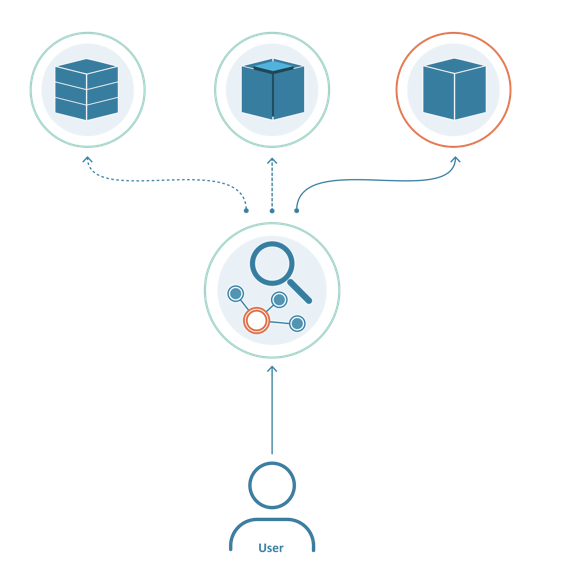
A BIM model can contain hundreds of thousands, if not millions of entities. Not every entity is relevant to every operation or analysis. Current BIM implementations allow for filtering, but not for any deeper way of assessing the contents of a model. This makes BIM models not only difficult to transfer, as even in filtered, paired down formats they can contain thousands of unnecessary objects. It is not possible to query the model in a way that will help answer some specific question or provide specific data necessary for a task during the project lifecycle. While the BuildingSMART model view definition provides a way of establishing what the minimum contents of a specific model view are (i.e., what should be contained in the structural analysis model) it does not go further.
How do knowledge graphs change to help make understanding models and querying information more straight forward?
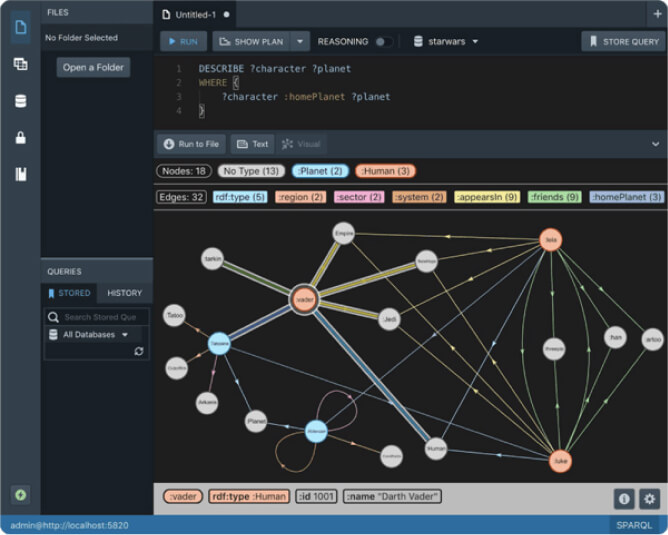
Stardog Cloud makes a model accessible on demand. This gives users the ability to retrieve data based on more than just the simple classifications available through MVD and BIM implementations. Using SPARQL users can now find objects based on their relationships, their values and other properties which can greatly improve workflows and decision making during the construction process.
Knowledge Graphs for BIM
Knowledge graphs provide an approach to answering these questions by taking the semantic agreements present in BIM and allowing these to be extended to support the point of view of other professional segments of AECO. It is noted by Pieter Pauwels, a researcher at Eindhoven University of Technologyplace, that the knowledge graphs and other semantic web technologies are natural extensions of BIM, as both focus on a similar approach of modeling in which geometry and data are represented together.
In this model semantics aid the digitalization of building data and the conversion of BIM from a passive repository towards a whole building-oriented data service, by providing reusable, extensible, and machine-readable data structures. Providing the ability to create services that are able to serialize, retrieve, and validate information concerning a project upon request.
Ultimately the goal is to move from a set of disconnected models each with their own semantics, to a decentralized data model that is accessible on-demand from different software and by multiple team members. The knowledge graph plays the role of orchestrating the exchange of data by providing a way of representing and navigating the resulting massive hypermodel in a way that supports each team member. Knowledge graphs are an ideal technology to supply the backbone for the digital transformation of AECO and the next generation of BIM.
Further installments of this blog series will describe in more detail how Stardog Cloud enables architects, engineers, contractors, and building owners to overcome these hurdles and turn data from a hassle into an asset by diving deeper into each of the opportunities outlined above.
Keep Reading:

Graph analytics with Spark
Stardog Spark connector, coming out of beta with 7.8.0 release of Stardog, exposes data stored in Stardog as a Spark Dataframe and provides means to run standard graph algorithms from GraphFrames library. The beta version was sufficient for POC examples, but when confronted with real world datasets, its performance turned out not quite up to our standards for a GA release. It quickly became obvious that the connector was not fully utilizing the distributed nature of Spark.
Joins and NULLs in SPARQL
Joins in SPARQL could be confusing to newcomers. You can hear some people celebrating the fact that they don’t need to write explicit join conditions (like in SQL) but if you actually look in the SPARQL spec, you will see the term “join” used like 67 times (as of Oct 2021). Furthermore, if you look at the join definition you will recognize the familiar relational operator that’s not so different from SQL.
Try Stardog Free
Stardog is available for free for your academic and research projects! Get started today.
Download now