Starbench and Dogfooding

Benchmarking is an essential part of developing any performance-sensitive software and Stardog is no exception. For a system as complex as Stardog, any single change in any part of the codebase might have unforeseen implications. Given that our customers have very different use cases, their data and query characteristics vary significantly making it harder for us to make sure their workloads will not slow down when we add a new feature or fix a bug.
Stardog + Benchmarking = Starbench
Starbench is the automated benchmarking tool we’ve built to measure the performance of Stardog over different datasets and workloads. There is a long list of benchmarks that we run nightly that checks the performance of bulk loading, reading, writing, backup/restore, validation, etc. Starbench started 7 years ago with publicly available RDF/SPARQL benchmarks like BSBM (Berlin SPARQL Benchmark), SP2B (SPARQL Performance Benchmark), and LUBM (Lehigh University Benchmark). It has evolved over the years with more benchmarks we collected from users and customers, along with custom benchmarks that we created to test specific features. It now contains about 100 different benchmarks.
We run Starbench nightly and measure the performance for each benchmark as an average of multiple runs. But daily averages might still fluctuate even when benchmarks are run with the same Stardog version because, well, computers are complex machines and there are lots of different things that happen at different levels of the system below Stardog (JVM, OS, hardware).
We use AWS for testing which also introduces some variance in the environment. For this reason, we check that the daily average is not slower than the expected average, which is calculated over the previous ten days. Even after these averages are applied, a benchmark performance can increase or decrease a few percentage points across different runs, so we have introduced different kinds of thresholds to filter out false positives and detect real issues.
My frequent mention of averages above might raise eyebrows as it is common knowledge that averages are bad and percentiles are better to understand performance. But even percentiles can be misleading as examined in detail in Gil Tene’s StrangeLoop talk. These are all valid points especially when you are monitoring a system in the real-world where variation can be very high (sometimes several orders of magnitude) but in a controlled benchmarking setting like we use where the variance is quite low (typical daily fluctuations we see are in the 10% range) using averages is good enough.
Dogfooding
Starbench started as a very simple script that writes the benchmark results to plain text files. When we started building the dashboard we needed to move the data to a real database. Eating our own dog food was the obvious choice (it is in or name, get it?) to store the data in a Stardog server, which we eventually moved to our Stardog Cloud infrastructure.
Once we could query Starbench history and results, it was simple to build a shiny dashboard that shows the results for each benchmark, highlighting any results that might be problematic, as indicated by yellow and red icons:
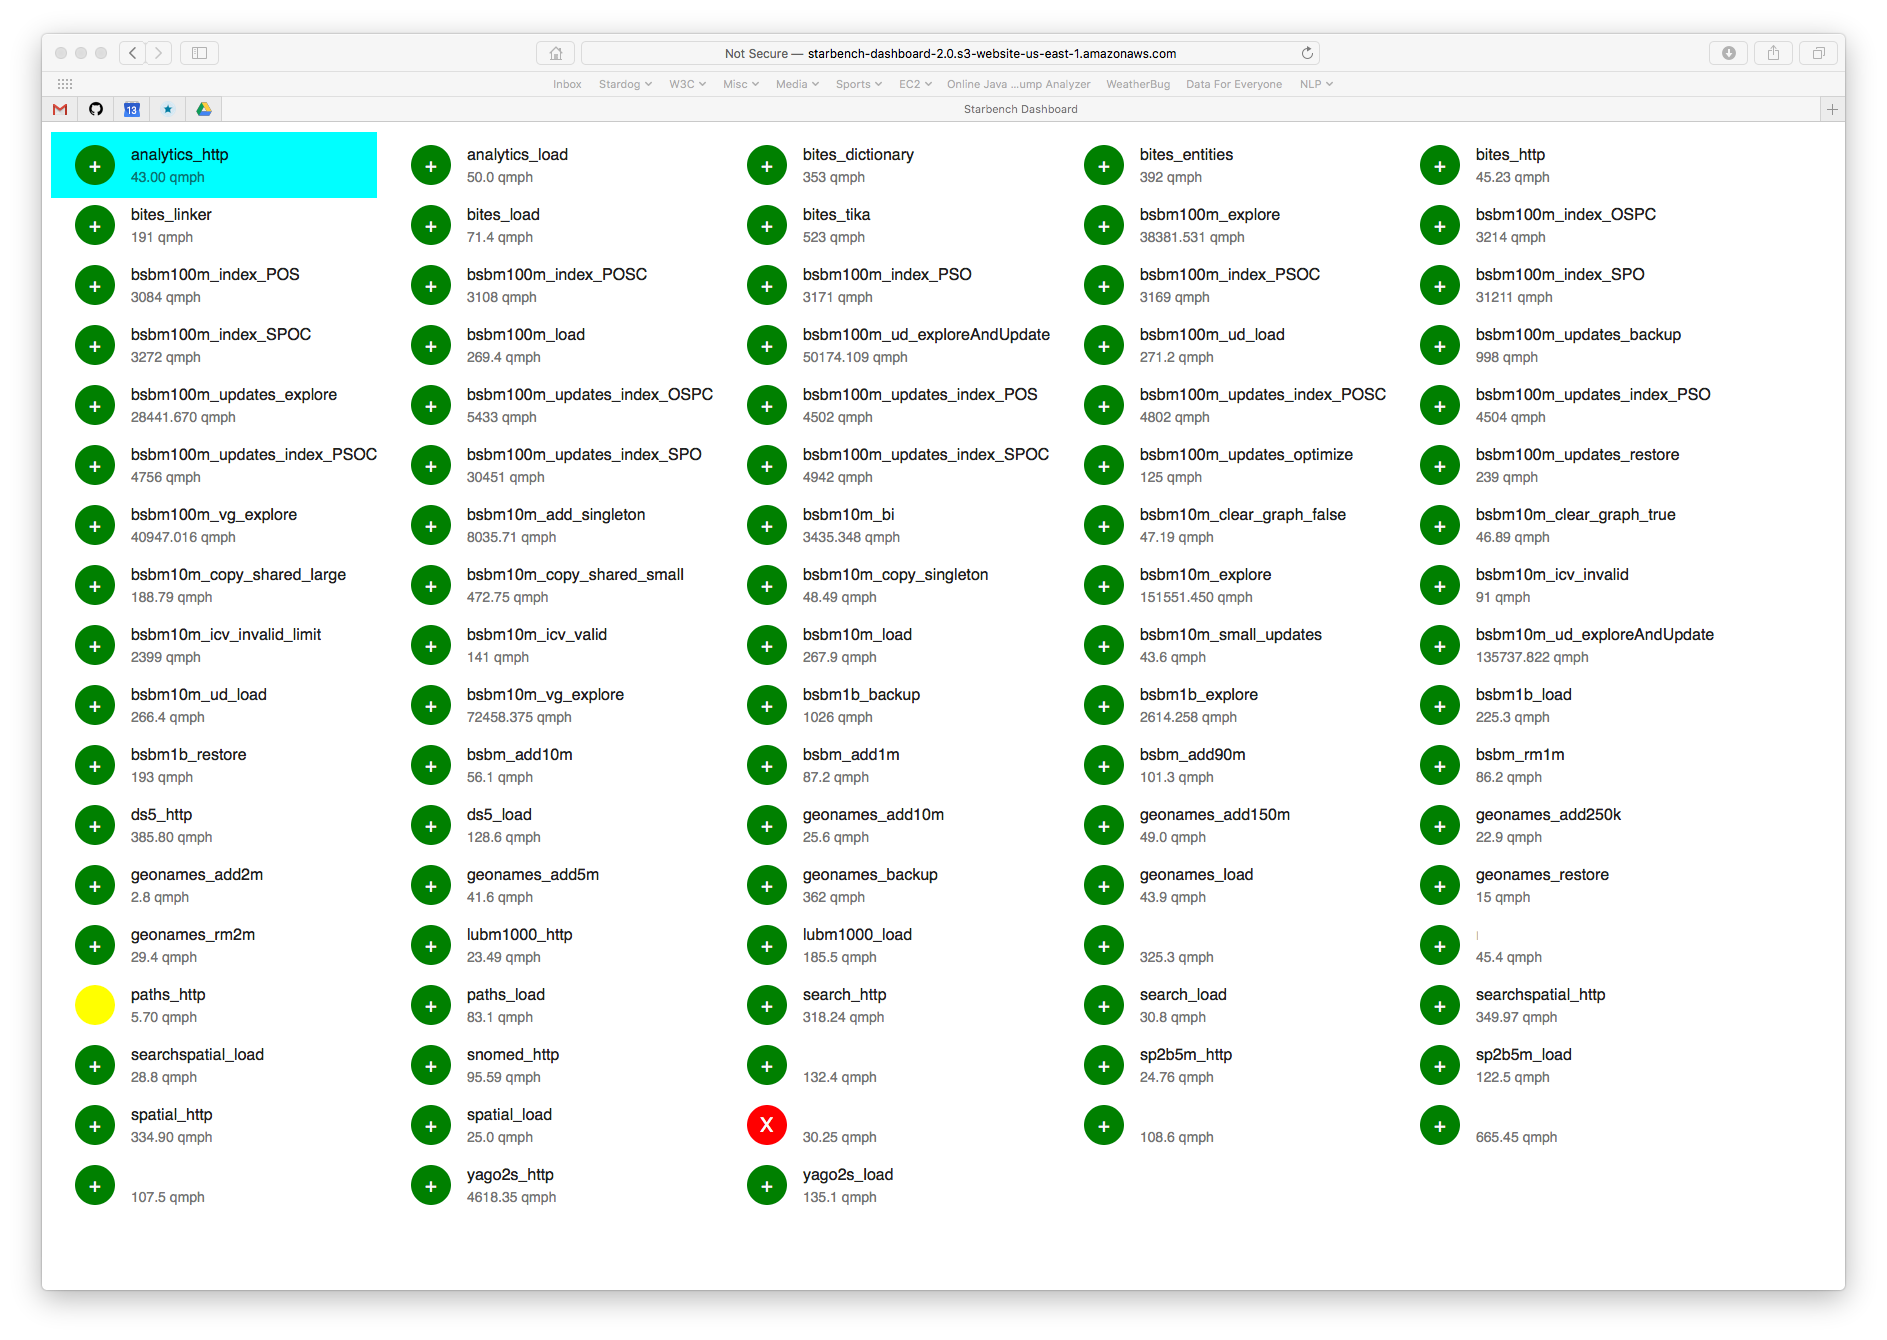
The nightly Starbench runs push data to Stardog Cloud and the dashboard queries Stardog Coud to pull the data. For any individual benchmark we can retrieve the history and display it as a chart and see when the slowdowns or speedups occurred:

Starbench lets us easily compare runs from different branches of the code so we can detect and fix any performance issues before changes get merged into the main development branch. The charts are nice for humans, but the process is also tied to our CI/CD infrastructure so comparisons are done automatically without the need for visual inspection.
One number to rule them all
It is great that Starbench has a lot of breadth and tests lots of different things, but this is also its curse. Read benchmarks use a different metric (query mixes per hour) than write benchmarks (nodes-and-edges updated per second). Write throughput depends on the initial size of the database, so it’s not possible to compare the results from one benchmark type with the results from another benchmark type.
This variety makes it hard to see the overall impact of a change on performance or to even conclude that there is nor isn’t an overall impact. Failures are singled out but improvements are not, and you also can’t see the general performance trend over time. We can see the trees but not the forest.
We’ve considered several different ways to combine these different metrics from benchmarks into a single number that will tell us if things look good or bad, but in the end we did not have a satisfactory solution for comparing apples and oranges. We finally decided to give up on the idea of a single metric and adopted a simpler approach.
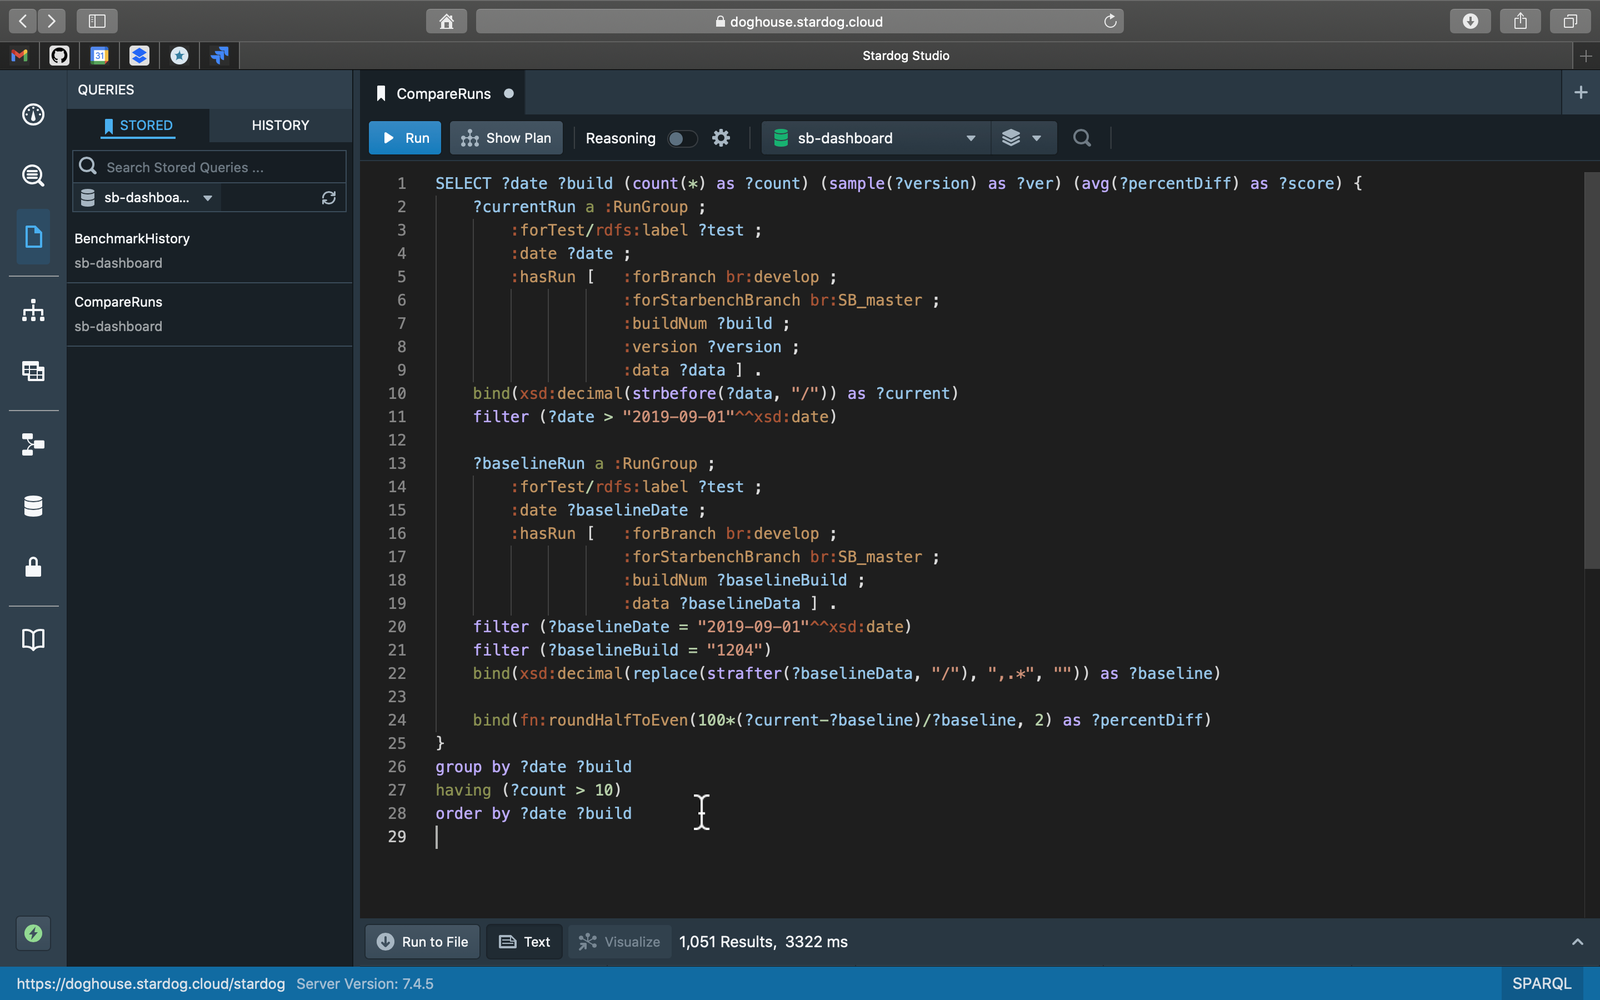
We might not be able to compare the results of benchmark X with benchmark Y, but we can compare the results of benchmark X today with the results of benchmark X from yesterday as a percentage change. If we calculate the percentage change for each benchmark separately, then we can calculate averages and at least get a sense of overall performance trend.
Happily this is elegantly expressed as a single SPARQL query, only 28 lines long. All we have to do is to choose a baseline version.
The following charts the score for each Stardog version released since 7.0.0:
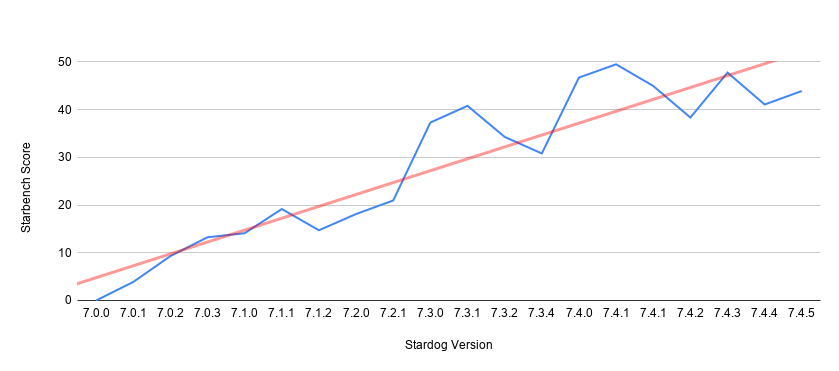
The fluctuations mentioned at the beginning are visible in this chart (blue line) too but we can also see a clear trend (red line) showing improvements over time. Stardog 7.4.x cycle gets a composite score close to 50 which means averaged over all the benchmarks these versions are almost 50% faster than 7.0. That’s exciting progress that we can quantify and talk about.
Some of the benchmarks improved more significantly, in some cases several orders of magnitude; but since we are computing the average over almost 100 benchmarks, the impact of one or a few big movers is more limited. We think this is the right perspective for us to maintain as a vendor serving a big market where our customers have different requirements. We don’t think Stardog performance is pareto optimal, which just means we can and do still make changes that are better for someone or for everyone while not being worse for anyone.
We can easily tweak this query to look at trends for read benchmarks separately from write benchmarks or focus on some other subset of the benchmarks without changing anything in our codebase. There are also other dogfooding possibilities we are considering. For example, it might be possible to use Stardog’s built-in machine learning capabilities to train a model to detect actual slowdowns and minimize false positives.
Stay tuned!
In later posts, we will talk about benchmarking in depth and provide details about specific benchmarks so stay tuned! In the meantime, you can get the latest Stardog and run your own benchmarks. Let us know what you find out.
Keep Reading:
Buildings, Systems and Data
Designing a building or a city block is a process that involves many different players representing different professions working in concert to produce a design that is ultimately realized. This coalition of professions, widely referred to as AECO (Architecture, Engineering, Construction and Operation) or AEC industry, is a diverse industry with each element of the process representing a different means of approaching, understanding, and addressing the problem of building design.

Graph analytics with Spark
Stardog Spark connector, coming out of beta with 7.8.0 release of Stardog, exposes data stored in Stardog as a Spark Dataframe and provides means to run standard graph algorithms from GraphFrames library. The beta version was sufficient for POC examples, but when confronted with real world datasets, its performance turned out not quite up to our standards for a GA release. It quickly became obvious that the connector was not fully utilizing the distributed nature of Spark.
Try Stardog Free
Stardog is available for free for your academic and research projects! Get started today.
Download now