Knowledge Graphs for Data Science - Part 1

A database, equipped with an optimized query language, is a powerful tool in the data science toolkit. We’ve all written our share of SQL queries to create data summaries, perform exploratory analyses, check for null values and other basic tasks. When data weigh in at over 1GB, the best approach is often pairing a good database, for basic data munging, with an analytic platform like R or Python for more nuanced calculations.
However, while we are used to seeing our data as rectangular arrays of information, that’s not always the best way to conceptualize the situation. This is particularly true of highly connected data and data with many missing values (incomplete information). And under the hood, performance issues arise in relational databses when the data are not suited to tabular representation. Recent years have seen the development of database systems that organize data in other ways. Graph has emerged as a powerful alternative to tabular databases.
Graph databases support different models of data organization and governance. Many data scientists have experimented with property graph databases, like Neo4J. Knowledge Graphs (KG) offer similar graph functionality, but with the added benefits of placing the data within their context to the Enterprise. KGs add meaning to data. We’ll see more about that later.
Stardog is a knowledge graph platform, a graph database, and a data integration tool. In this series of blog posts, I’m going to show you how Stardog can contribute to the data science pipeline. In later posts, I will touch on the specific benefits of KGs over property graphs. But for this post, I’ll walk you through a simple example to give you a sense of what it feels like to work with KG concepts.
And if you don’t already have Stardog installed, you can get yourself a free version here. Request a license, follow the installation instructions and you’re good to go. There is no expiration date and no credit card is required.
The data
Knowledge graphs (KG) are by no means limited to “graphy” data – networks and the like. For this example, I have chosen a data set from the City of Toronto’s open data portal. This set records daily E.coli measurements at each of 12 Toronto area beaches through the summer months (beginning of June through beginning of September) of 2007 to 2013. We might be interested in comparing beaches to each other, comparing years, or examining daily changes in e. coli levels. In addition to the e. coli measurement, there is a “status” column that indicates whether the beach is deemed Safe or Unsafe. As we shall see below, that column is used for other information as well.
KG’s are favoured for data integration tasks, and to demonstrate that feature, I am also using some weather data from Environment Canada for the summer of 2011. Environment has several weather stations in the Toronto area, but I’m only looking at data for the Toronto Center Station (ID 30247). For summer 2011, we can check if humidity, temperature or rainfall affect changes in E.coli levels.
As an added wrinkle, the weather data is recorded hourly, but the E.coli data is daily. When I combine the two data sets, I will need to average the weather data over the day, and then link corresponding days. In Stardog, this is easily done.
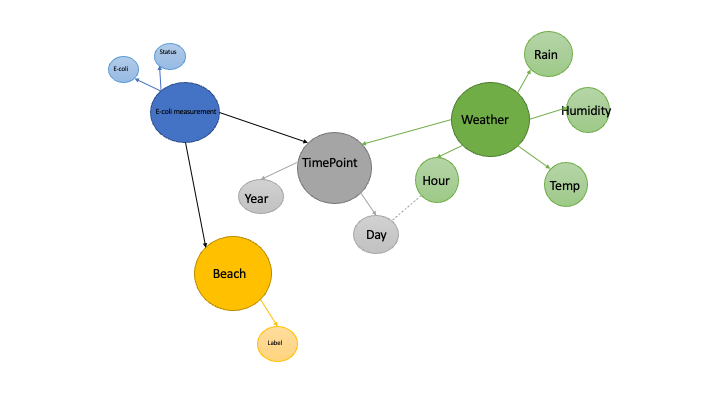
To enter data into a KG, we need to give our data a graph format. In this case, I want my graph to mirror the statistical structure of the problem, with different nodes for sampling units, factors and time.
Knowledge graphs in 30 seconds
KGs go beyond simple graphs of nodes and edges by allowing nodes and edges to have different classes or types. Each beach has a node in the graph, and each sampling unit has a node, but they have different classes. Temperature and humidity are each properties of the weather_sample node class, and the edges connecting them each have their own name. This means that we can write queries that limit their scope to particular classes and properties.
The big picture
As data scientists, we are used to thinking of each project we do as a distinct piece of work, with its own data. KGs are built on the philosophy that any set of data might some day be connected to another set. I might want to include beaches from other cities to this study, and weather from those cities. I might want to include data on the number of attendees at those beaches, if that information came available. When this happens, we don’t want identifiers for the new data to clash with the old. One way that KGs address this problem is by assigning unique identifiers (IRI’s, or Internationalized Resource Indicators) to the major nodes of the graph, the nodes that denote entities of interest. So in this example, each sampling unit has an IRI, but the values of the sample - E.coli count and status - are stored in data nodes that do not have IRI’s. The latter are uniquely identified through their relationship to the IRI node. I have shown the entity nodes in strong colours, and their respective property nodes in pastel versions. Note that it is up to the database designer to decide which nodes are properties and which are entities. To my mind, one of the most useful aspects of KGs for data scientists is that they encourage us to view data as an evolving and ongoing resource that is not limited to any one project.
Running the example
In a follow-up piece I go through mapping the beaches and weather data to Stardog. But for now, you can import the graph directly to a Stardog database.
- Download the data [here](link to beaches.ttl)
- Open a terminal box (or PowerShell) in the folder that contains
beaches.ttland do:stardog-admin server start - Create a database and import the data:
`stardog-admin db create -n beachesDB beachses.ttl
- Windows users will need to open a second PowerShell window for command line work.
- Get the total number of triples as a reality check that it worked: `stardog query execute beachesDB “select (count(*) as ?n) {?s ?p ?o}”
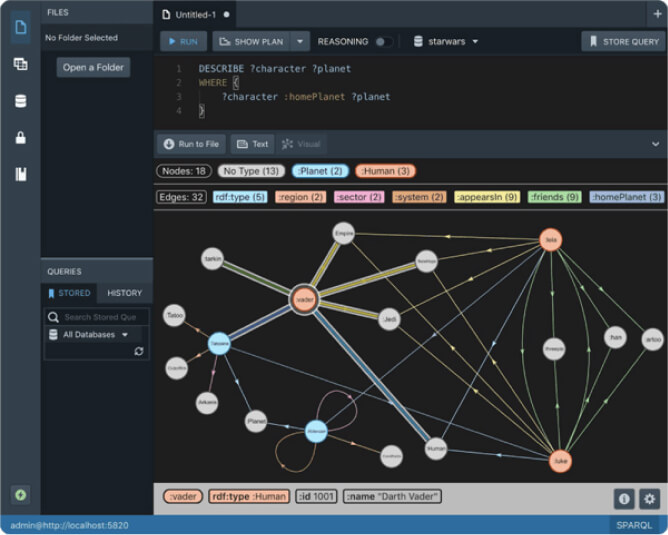
Executing queries: sparql in 30 seconds
Stardog supports sparql 1.1. There is a friendly introduction in the Stardog Docs. The basic idea is that a query matches triples. We can fix the value of a component of the triple, or we can use wildcards, prefixed by a ?. Further limits are placed on the triples in the where clause of the query. As with SQL, a query can also be used to aggregate data and effect functional transformations.
We can query Stardog in several ways. In the previous example, we ran a query from the command line. We can also run queries from a Jupyter Notebook as part of a Python workflow. I conclude this introduction to Stardog with some queries from a notebook against the Beaches data. This notebook gives a number of examples of how we can explore the data using sparql, and then merge the E.coli and weather data for further analysis. You can obtain the notebook, along with all the files used to created this example, from the Stardog examples repo.
- Download the notebook.
- Source your favourate Python environment for data science.
pip install pystardog- Launch Jupyter and open
beaches.ipynb
Finishing up
When your work is finished, you can stop the Stardog server at the command line:
stardog-admin server stop
Other useful commands
To check the status of the Stardog server:
stardog-admin server status
To list your databases:
stardog-admin db list
To delete a database:
stardog-admin db drop myDB
to remove the data from a database, but retain the database.
stardog data remove --all myDB
Tell me more
For documentation on the command line, check out docs here for db commands and here for data commands
For a deeper introduction to KGs, see this video. You can learn how KGs store and query data (RDF and sparql respectively) at Stardog Academy, along with other features of the platform. For documentation and tutorials, follow the links here
Keep Reading:
Unified Process Monitoring
Did you ever have a slow query, export or any other operation and wondered “Is this ever going to finish?!”. Many operations such as SPARQL queries, db backups etc have performance characteristics which may be hard to predict. Canceling rogue queries was always possible, but there was not yet a way to do so for other potentially expensive operations. If this ever affected you then the new unified process monitoring feature we added in Stardog 8.

Chaos Testing Stardog Cluster for Fun and Profit
At Stardog we work hard to build software that’s not only performant but also extremely robust. Stardog Cluster is a highly available, key component to ensuring Stardog remains up and running for our customers. However, every distributed system is susceptible to faults and bugs wreaking havoc on it. Most software testing checks the “happy path” through the code to verify it behaves as designed. Moving a step further, tests can check some obvious failure cases; for example, if one service in a deployment is terminated.
Try Stardog Free
Stardog is available for free for your academic and research projects! Get started today.
Download now