Using Stardog and Knowledge Graphs for ESG Business Impact Analysis

Pressing environmental, social and governance (ESG) challenges require data-intensive insights. The ESG market is large and rapidly growing, with sustainable investments growing to more than a third of all global assets, and sweeping environmental regulation being passed world-wide. This confluence of events presents opportunities, and a demand for reliable, insightful data about companies’ performances, and their impact on regional environmental and climate conditions. Amplifying the problem, ESG metrics are usually just a collection of raw, numbers that require study and interpretation with each use.
ESG Impact Knowledge Graph
Data innovations for ESG need to be based on robust, transparent foundations. Knowledge graph technology can be used to provide a rich, contextual view – connecting data from disparate sources and providing backing semantics for the data’s concepts and relationships. Using knowledge graphs, users can gain richer, contextual insights into the problem space and create reusable knowledge.
In order to raise awareness of the use of knowledge graph technology for ESG business planning, the Impact Demo Knowledge Graph was constructed and used in the Hanken Quantum Hackathon 2021. A backing ontology was defined to fuse information about 1900+ companies – including their industries, profits, environmental impacts, and country of headquarters – and relate that with data about their “headquarters” country. The company data provided calculated dollar amounts (in US Dollars) for various types of environmental impacts. This data was extracted (using Python code) from a spreadsheet based on the Harvard study, Corporate Environmental Impact: Measurement, Data and Information. The country data, on the other hand, provided statistics on a country’s electricity production, environmental issues, demographics and many other details. It was assembled by web scraping the pages of the CIA World Factbook.
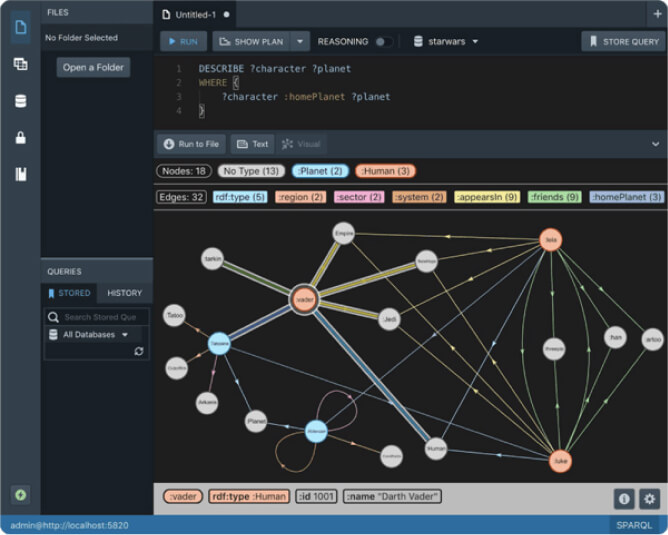
All the data for the Quantum Hackathon was stored in a Stardog graph database, hosted in the cloud. Each of the 14 Hackathon teams had an account. There were 12 stored SPARQL queries for modification and use by the teams, to ease the learning curve. An overview of the infrastructure (the ontology and data), as well as details on using Stardog Studio and Explorer, were provided via written documentation on GitHub and a video overview.
See Stardog in Action
In order to see Stardog’s value in action … take a look at the video. The Stardog portion of the overview starts at about 19:50 minutes. Let us know if you have any questions or feedback about this use case.
Keep Reading:
Unified Process Monitoring
Did you ever have a slow query, export or any other operation and wondered “Is this ever going to finish?!”. Many operations such as SPARQL queries, db backups etc have performance characteristics which may be hard to predict. Canceling rogue queries was always possible, but there was not yet a way to do so for other potentially expensive operations. If this ever affected you then the new unified process monitoring feature we added in Stardog 8.

Chaos Testing Stardog Cluster for Fun and Profit
At Stardog we work hard to build software that’s not only performant but also extremely robust. Stardog Cluster is a highly available, key component to ensuring Stardog remains up and running for our customers. However, every distributed system is susceptible to faults and bugs wreaking havoc on it. Most software testing checks the “happy path” through the code to verify it behaves as designed. Moving a step further, tests can check some obvious failure cases; for example, if one service in a deployment is terminated.
Try Stardog Free
Stardog is available for free for your academic and research projects! Get started today.
Download now