Turn These Five Friction Areas Into Data Sharing Opportunities

Get the latest in your inbox

Get the latest in your inbox
As companies seek to share data and knowledge broadly across and outside their enterprise boundaries, there are inevitably points of friction that hamper the ability to connect and use data across domain, functional, and geographic silos. Traditional approaches to data management and integration operating under the guise of “modern cloud platforms” continue to only exacerbate the situation and add to this friction. The good news: whenever problems exist, there are opportunities for improvement. The problem areas in this struggle create opportunities for companies to address data sharing and accelerate their data analytics and AI goals.
Having a data sharing strategy to use data assets efficiently and effectively is the only way to grapple with growing volumes of data and distribution across hybrid cloud and multi-cloud environments.
As Gartner said in a recent report:
“Growing levels of data volume and distribution are making it hard for organizations to exploit their data assets efficiently and effectively. Data and analytics leaders need to adopt a semantic approach to their enterprise data; otherwise, they will face an endless battle with data silos.” — Gartner, “Leverage Semantics to Drive Business Value from Data,” November 2021.
Gartner suggests — and we agree! — that data and analytics leaders need to adopt a semantic approach to their enterprise data to move business forward and win markets.
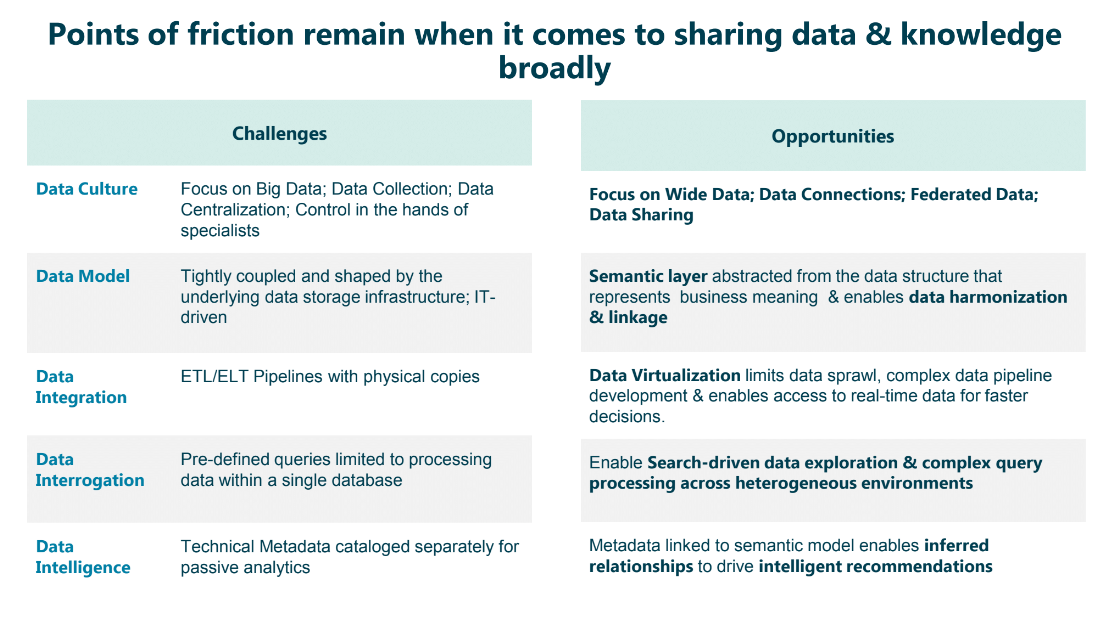
When it comes to broadly sharing data and knowledge, we can categorize the common points of friction into five areas:

Let’s take them individually and explore each area’s challenges and opportunities.
As the data executive, data leader, or data champion inside the enterprise, you need to determine the data culture you’re trying to create. Here are some questions to ask yourself:
There is a better way than what has traditionally been done.
A lot of that traditional culture tends to focus on big data, data collection, and data centralization. In this type of scenario, data control lives in a few specialists’ hands.
In terms of working with data, opportunities lie in shifting the focus to wide data.
Wide (or comprehensive) data means working with data that sits across domains, silos, and functions. It means finding data, connecting data, and federating access to that data, but not necessarily collecting or physically moving data. A data sharing culture focuses on architecting for the data consumers rather than the data producers.
A data sharing culture opens valuable data resources up to more citizen data users inside the enterprise.
Data models tend to be tightly coupled with, and shaped by, the underlying data storage infrastructure.
To be more precise, a data model is shaped by where the data is stored, SQL versus NoSQL, for example. And frequently, how we model the data itself is shaped by some application or workflow we’re trying to support, or perhaps a project needed to support ad-hoc data analysis.
Opportunities exist when you consider abstracting the data model away from how it’s stored in terms of tables, columns, and strings to how it needs to be consumed as “concepts” and “things” that represent business meaning to the consumer. Ask yourself:
Decoupling the data model from its infrastructure and representing it in terms of business meaning offers a strong opportunity to enable data harmonization across domains and silos and enables ultimate flexibility to re-use or re-shape data logically rather than making copies and physically shaping data to answer new questions or supporting new data-driven initiatives.
Data professionals know all too well the tendency to skip ahead to moving and copying data to support different data-driven initiatives. Shifting ETL to ELT is an example of this. But this approach adds time and complexity and on-going maintenance of brittle data pipelines that get impacted with changes to the source systems. In other words, decisions are made, and actions are executed without knowing the full scope of the actual needs inside the business.
Data movement by making copies of data creates data sprawl, ultimately posing data security challenges. The repetitive desire to keep building more ETL/ELT pipelines adds even more complexity and creates friction in delivering the data that the business needs to make fast decisions.
And so the dilemmas are:
There is an opportunity to think about this within the context of virtualization. The best way to limit data sprawl is by leaving data where it is, in the source.
Virtualization enables access to data while reducing the complex data pipelines that need development and maintenance. Not in a snapshot, but actual real-time information that reflects the latest and greatest data in your organization.
Virtualization improves speed and agility, enabling deeper ad hoc analysis that addresses the pressing needs of the business. No more building complex data pipelines.
Most analysts struggle with knowing what data is even available across their enterprise.
Data interrogation is still very much a “Tell me what you want; What question do you want to ask?” approach. And then, someone writes queries to answer that specific question. That traditional approach is designed for centralized data, which isn’t reflective of most enterprises in 2023.
The real opportunity lies in the ability for users – even business users – to explore and search enterprise-wide data on their own.
Imagine your organization using a search-driven style à la Google. Thanks to Google, the notion of a knowledge graph has been popularized. You can search for things, and you get related ideas presented back to you from all kinds of sources.
A knowledge graph approach also supports more complex query processing and enables analysts to look at data two or three hops of connected distance away from the actual element being searched. This can be done incredibly efficiently across a heterogeneous environment rather than centralizing everything inside a single repository.
More importantly, this approach enables citizen data users to self-serve through model/metadata-driven search, visual exploration, and querying without requiring IT skills, reducing the dependency on limited and expensive resources to enable data interrogation and, in turn, increasing their productivity.
Traditionally, “data intelligence” has tended to be a cataloging exercise, providing a catalog of the available metadata for passive analytics. From that, users can run simple queries to understand what data is available and perhaps even understand the data lineage.
But consider the opportunity to query both the data and the metadata at the same time. By linking metadata to the actual semantic model, users can infer relationships across their enterprise-wide data landscape and accelerate data orchestration and insights.
More importantly, because metadata is tied to the data being queried via the semantic layer, any user can query and ask the next question, which shows the data itself, and then use that information to drive recommendations for creating more connections to data from other places. A semantic model enables users to leverage metadata that might be semantically similar — even if it may live in another data source. For example, an analyst needing information about ”vehicle” might search the catalog for “mileage” and find a column in a table called “auto.” This type of data exploration and discovery may serve the needs for feature engineering purposes as well.
There are many possibilities to help accelerate your data analytics and AI goals. We believe that the biggest opportunity is in building a culture of data sharing and self-service across users, from data engineers to business analysts. This data democratization is made possible today by an enterprise knowledge graph powered semantic layer.
Knowledge graphs are on the rise in enterprises hungry for greater automation and intelligence. The flexibility of the graph model, along with its explicit storage of data relationships, makes it easy to manage data arriving from diverse sources and reveal new insights that would otherwise be difficult to discover.
According to a recent Gartner report:
“In a data fabric approach, one of the most important components is the development of a dynamic, composable and highly emergent knowledge graph that reflects everything that happens to your data. This core concept in the data fabric enables the other capabilities that allow for dynamic integration and data use case orchestration.” — Gartner, “How to activate metadata to create a composable Data Fabric,” July 2020.
An enterprise knowledge graph fills that critical gap in existing data management tech stacks. Fitting nicely between where data is stored, cataloged, and consumed, enterprise knowledge graphs eliminate data access barriers, add meaning to data through semantic models, and promote a culture of self-service and self-sufficiency.
Stardog’s Enterprise Knowledge Graph platform can:
It’s easy to get started using Stardog. We provide the perfect fit for jump-starting your proof of concept and getting to your first knowledge graph.
How to Overcome a Major Enterprise Liability and Unleash Massive Potential
Download for free