Charting Data Provenance in Studio

Get the latest in your inbox

Get the latest in your inbox
Stardog Studio v1.20.0 introduces Provenance, a new hub for viewing how your existing enterprise data sources breathe life into your Knowledge Graph.
Stardog helps you deal with the inherent complexity of the enterprise data ecosystem where the pieces of data that make up your most important concepts, the things that are most integral to your business, can come from anywhere. It does this by unifying your most important data sources into a single, logical layer.
However, as you begin to leverage your Knowledge Graph, one of the first questions that you may need to answer is, “Where is this data coming from?”
Which means you need a way to peek behind the curtain of the Knowledge Graph and see how it’s built, and more importantly, what it’s built from. Being able to trace data to its source can help your developers understand if they’re building along the right path, and it can help stakeholders lend credibility to the solutions built using the Knowledge Graph.
So we set out to build Stardog Provenance.
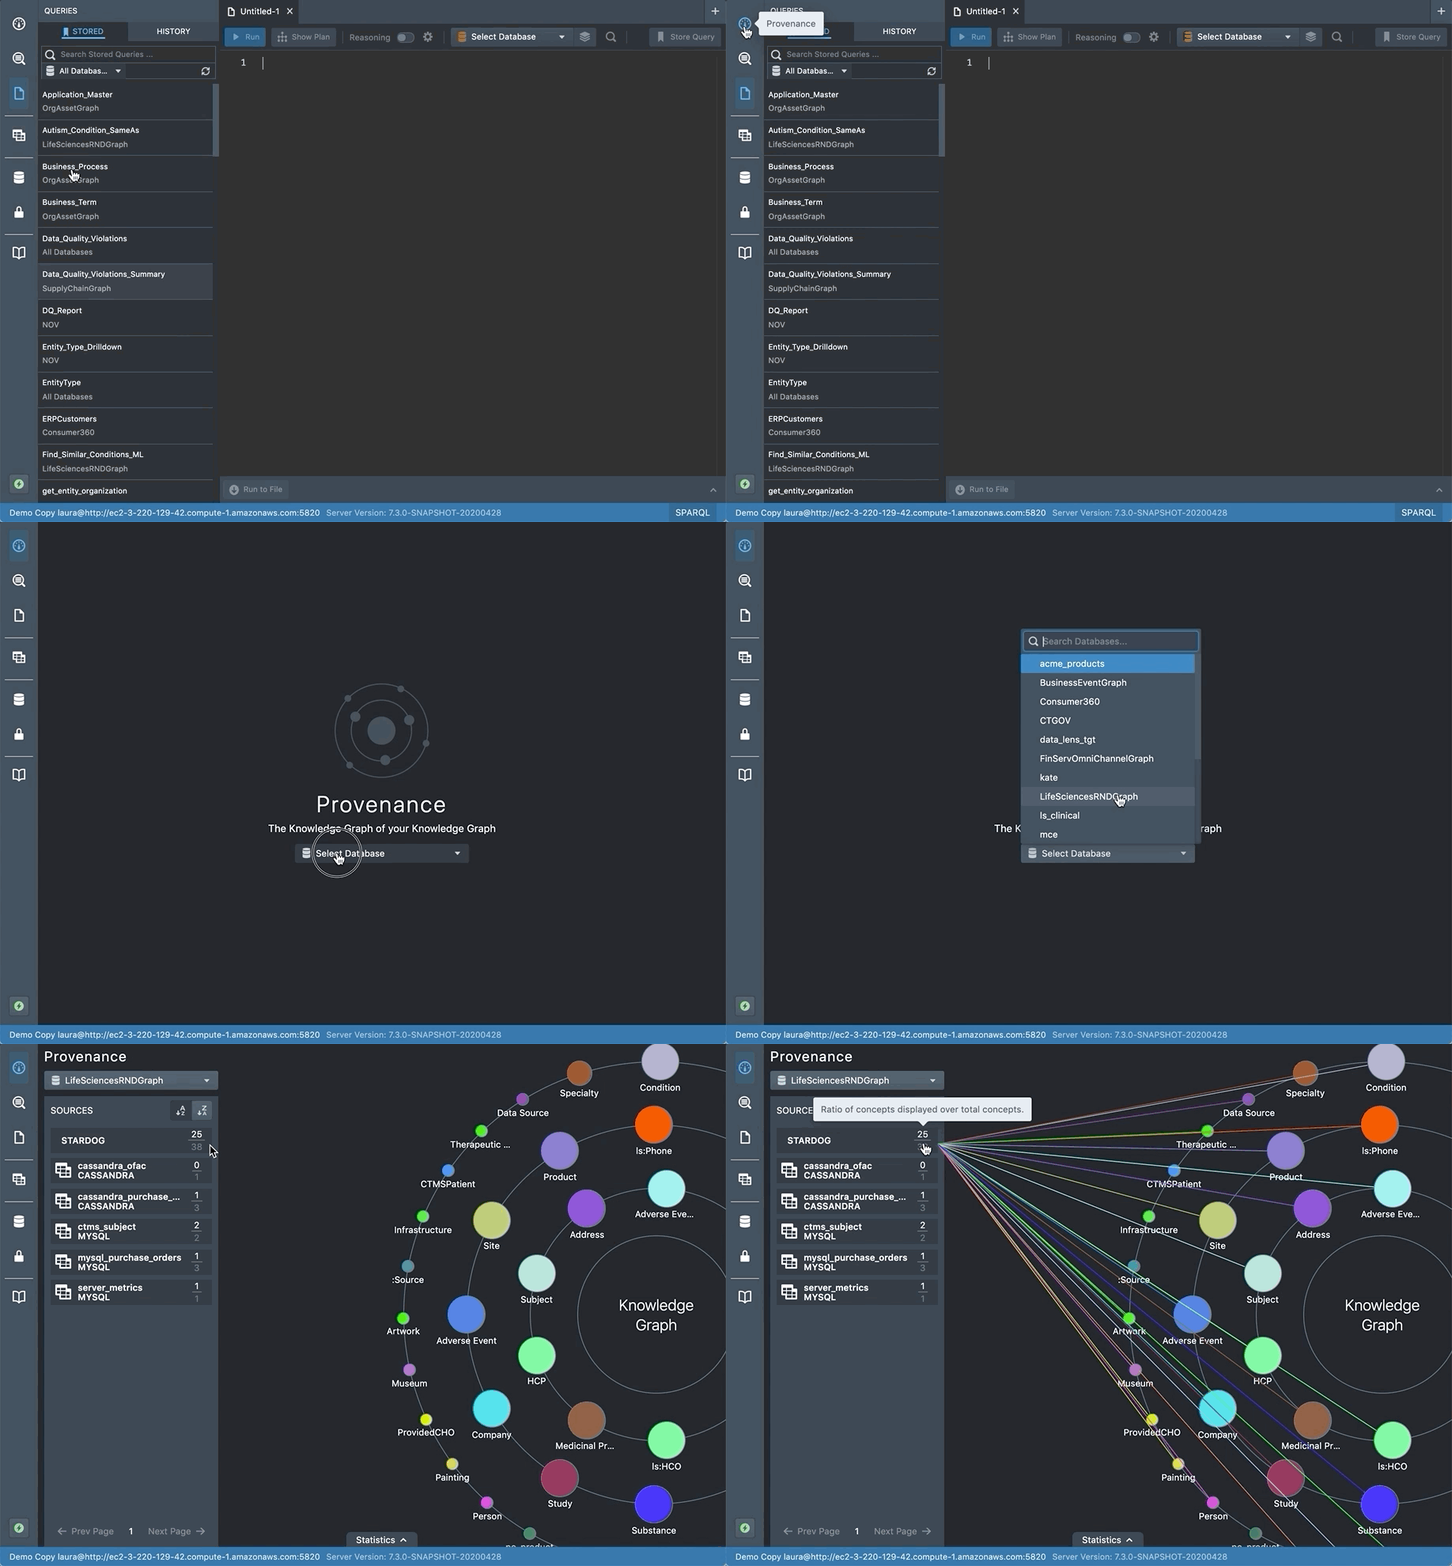
Stardog Provenance is a simple way to see how the data sources that make up your Knowledge Graph align and populate the concepts in your data model. This can give you a high level view of how your existing enterprise data sources breathe life into the Knowledge Graph.

With a simple hover of a mouse or a single click, you can see which classes come from which sources or how classes are populated by the upstream sources.
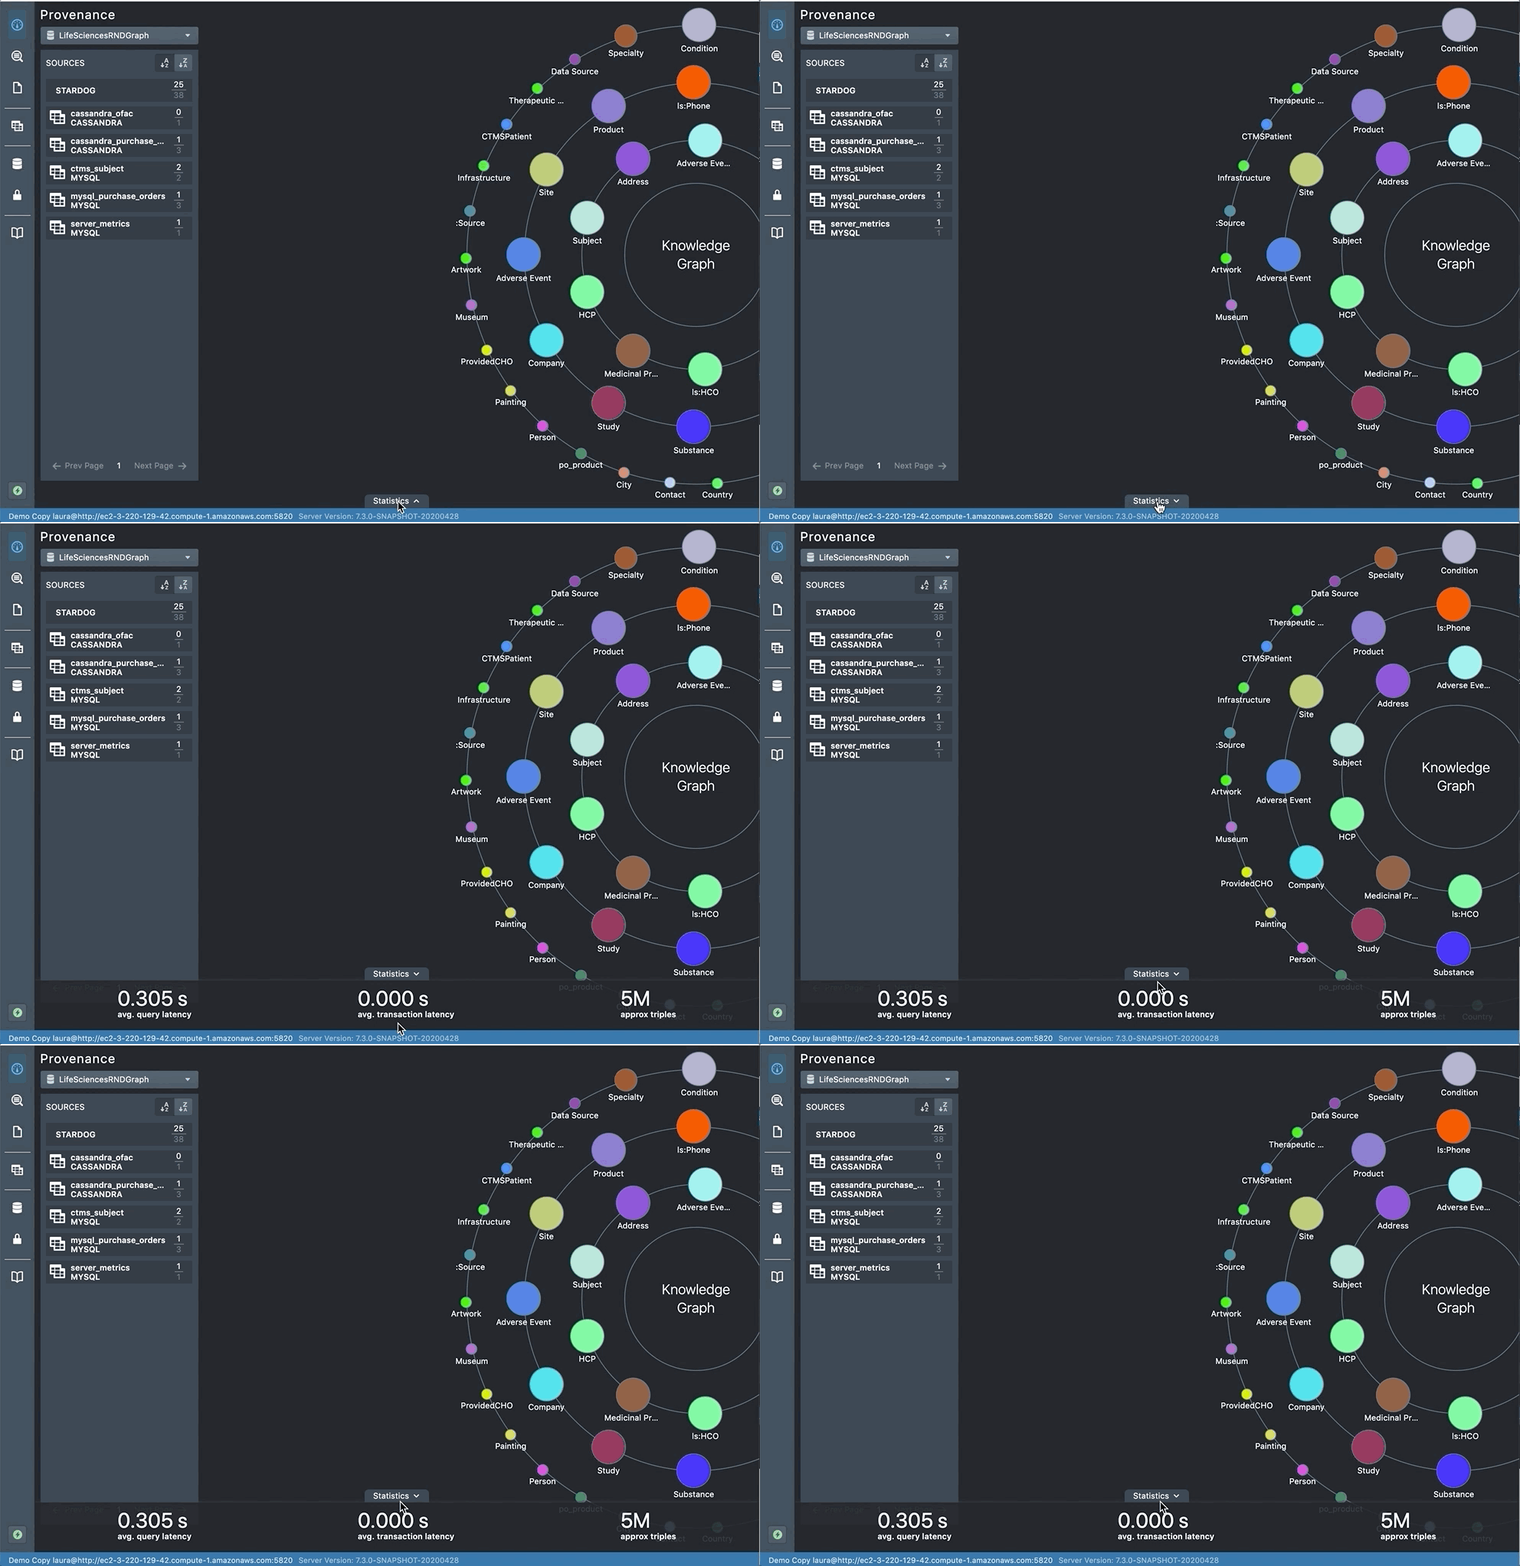
Provenance highlights the connections between your data sources and concepts loaded into the Knowledge Graph. It shows the various concepts that have been instantiated, with circle size equating to the relative quantity of data. You can dig further into this information by clicking on each circle to see counts showing the number of instances of a concept.

Statistics for interactions with the Knowledge Graph and amount of information defined are provided across the bottom of the screen. “Query latency” shows the speed at which data is returned from Stardog. “Transaction latency” shows the speed at which data is written to Stardog. “Approximate number of triples” shows the amount of data stored in Stardog.

The Stardog Studio team is continually working on features to make it easier for you to unify data and see the value of the Knowledge Graph. Try Studio out for yourself today. If you have any feedback or suggestions, we would love to hear from you in our Community!
How to Overcome a Major Enterprise Liability and Unleash Massive Potential
Download for free