Put your unified data in the hands of more analysts with Stardog’s new BI/SQL server, which provides a straightforward connection to SQL-based Business Intelligence (BI) platforms like Tableau and Power BI.
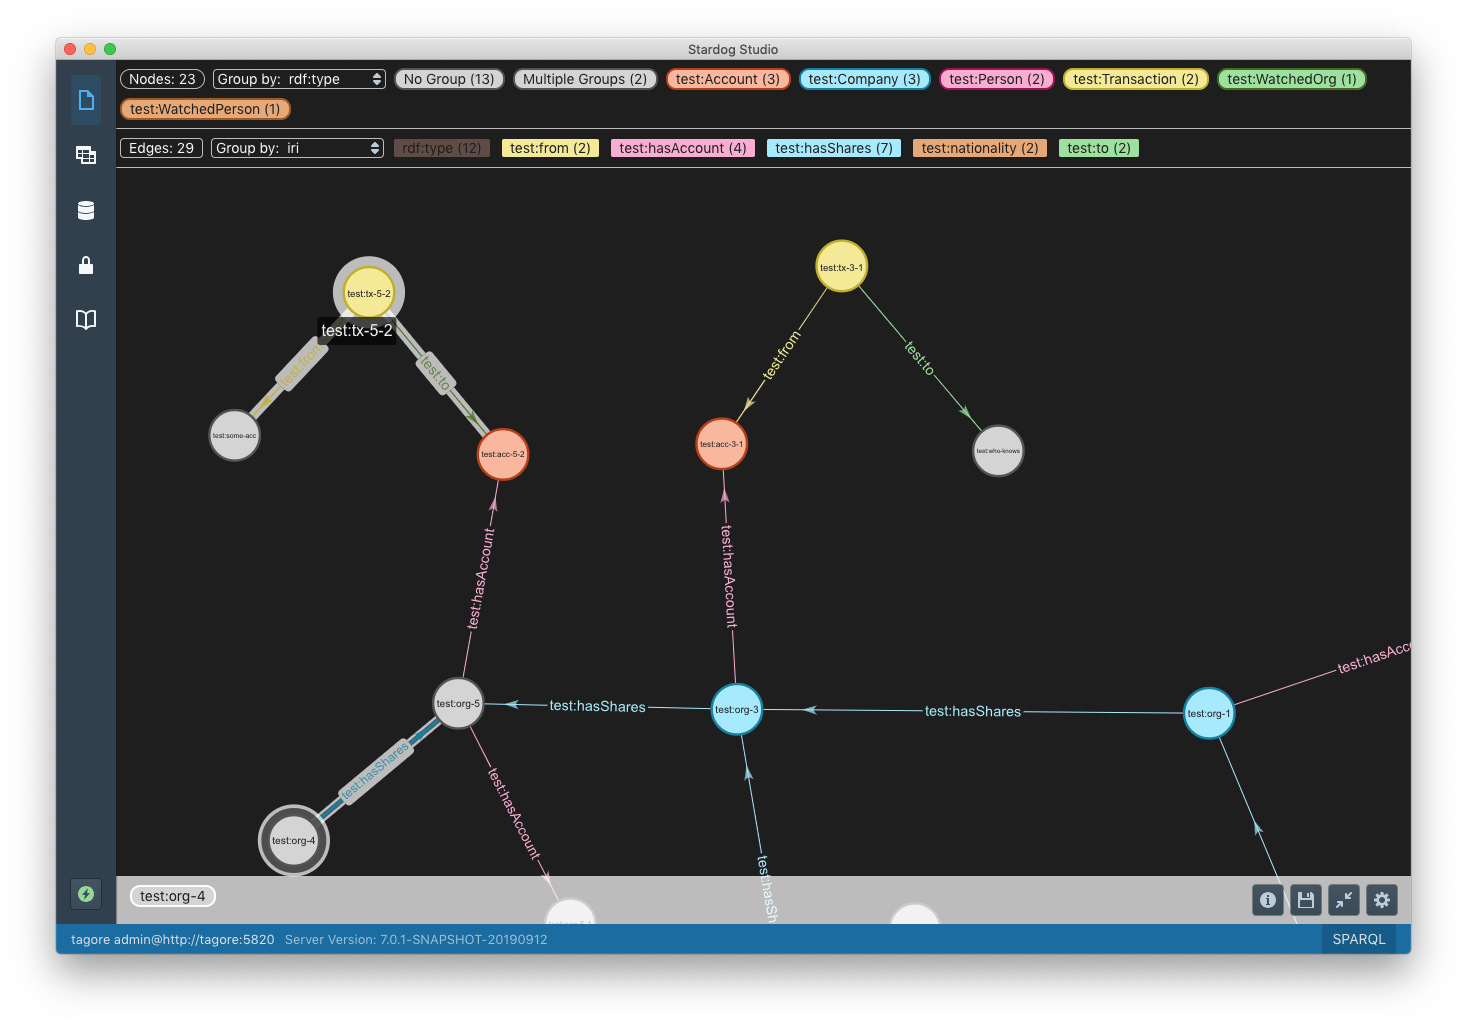
Stardog’s ability to unify disparate data sources and represent complex logic allows users to answer tough questions that would be impossible or impractical to answer with SQL. Whether you’re analyzing dependencies in data that’s stored in multiple sources or performing complex impact analysis, Stardog is designed to be performant and scalable. Our own Stardog Studio provides the visualization capability to explore these graph relationships and browse your data.
Unified data also associates related data from different departments and is automatically kept up to date thanks to virtualization. The high quality of unified data also makes it hugely useful throughout the organization, and Stardog’s new BI/SQL server provides broader access for subject matter experts and citizen data scientists to investigate their data.
Translating graph data into BI tools
While graph visualization is ideal for identifying connections between entities, there are still many cases that call for visualizations like bar charts, line graphs, histograms, or map visualizations. Traditional BI tools like Tableau and Power BI are packed with features to generate these types of visualizations over tabular data. These tools also allow people who might not know how to write a SQL query to gain insight from their data.
However, none of these BI tools know how to work with graph data out of the box. Our previous solution for BI integration was a custom data connector that can pull data from Stardog into Tableau. However, these kind of custom connectors still required someone to write SPARQL queries to get the data into the BI tools.
In the Stardog 7.0.2 release we are introducing the beta version of a BI/SQL server that allows Stardog to be used natively with BI tools that use traditional relational models. Now, BI users don’t need to learn the details of the SPARQL query language and can simply interact with the Stardog graph data as if it were a relational system.
Straightforward setup
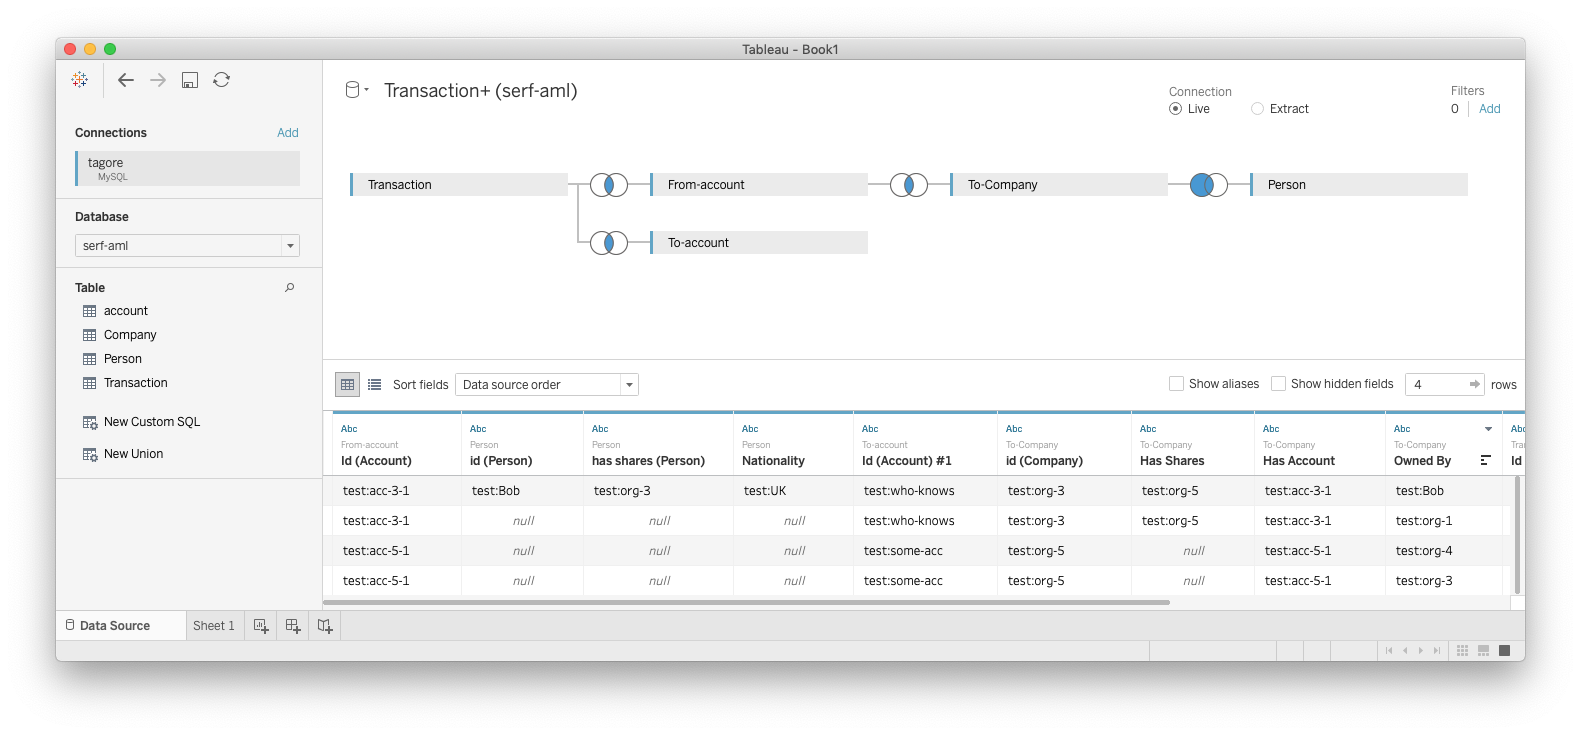
The only setup needed to use the BI integration capability is for users to define the SQL schema that will be exposed by Stardog once and specify which parts of the graph will be used to back this relational model. The graph model is more flexible than the relational model, and while not all the details of the graph structure can be expressed in tabular form, the user has the option of choosing how much of the graph will be visible to BI system and in what structure.
Stardog features like the Inference Engine and virtualization provide a significant improvement in the analytics capabilities of these BI tools. For example, as visualizations are created in Power BI, virtual graph queries would run behind the scenes allowing users to analyze data from multiple data sources as if all the data is stored in one data source. Similarly, if you had a dozen different point-of-sale data sources, you can write a Stardog rule defining the relevant columns as geographic coordinates so that Tableau can automatically display all twelve sources on one map.
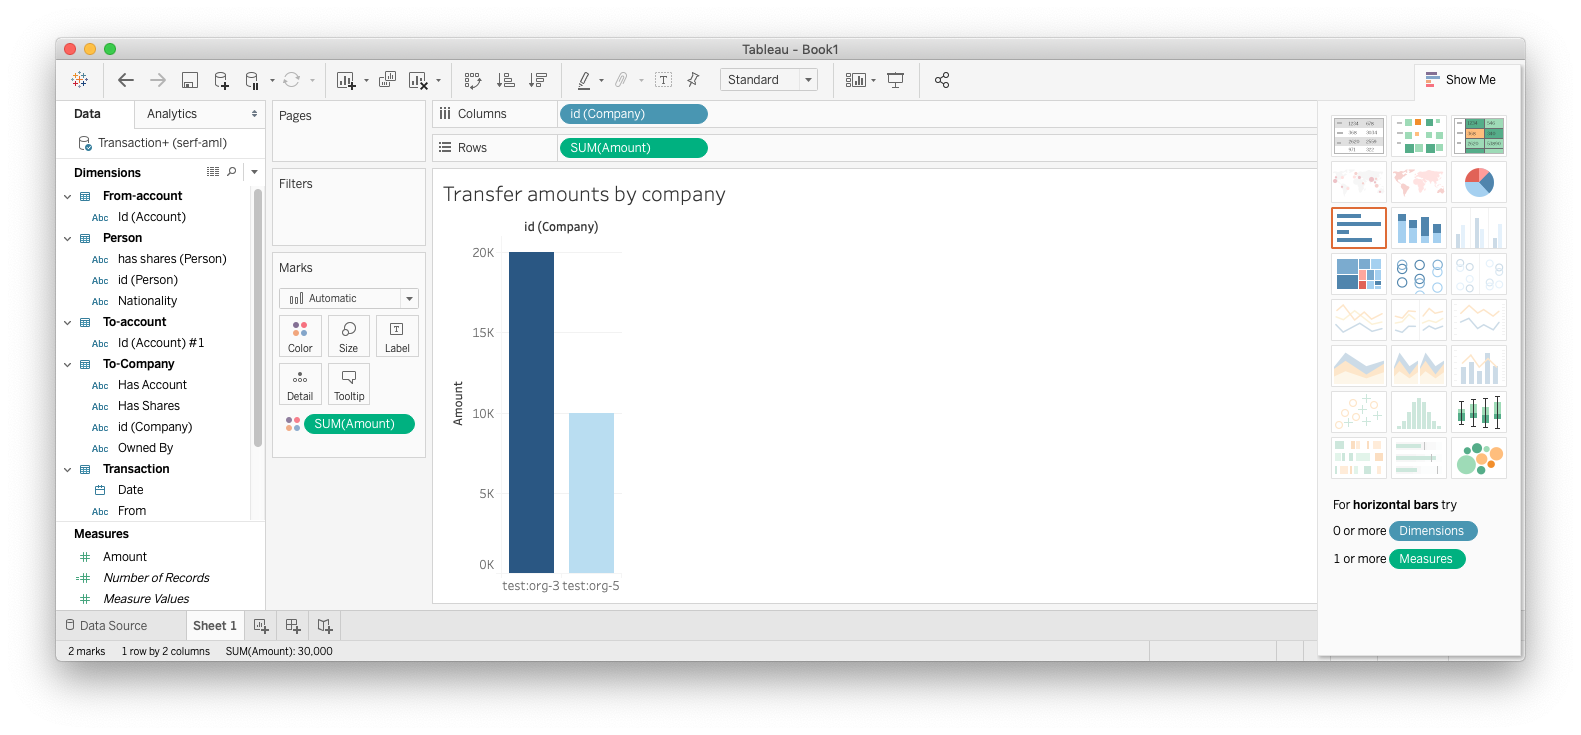
Once the SQL schema for exposing the knowledge graph is created, users can take advantage of the full power of SQL-based relational clients. We officially support Tableau and Power BI and will be testing other popular platforms to provide optimal integration with Stardog. However, other relational-based visualization and reporting tools should work with the Stardog BI/SQL server, so you can get to exploring how to incorporate this into your workflow.
Try it out!
We will continue to improve our BI integration capabilities and plan to support more of your favorite tools as this functionality moves out of beta. I hope you try out the latest version of Stardog and let us know what you think about this new BI integration capability in our community forums.
