Over the last decade, Stardog has helped data engineers and scientists from companies like NASA, Bosch, and Cisco greatly unleash the power of knowledge graphs.
But there was still a major step to achieve Stardog’s mission of solving data sprawl: to simplify the understanding, implementation, and management of knowledge graphs, making them accessible to more people.
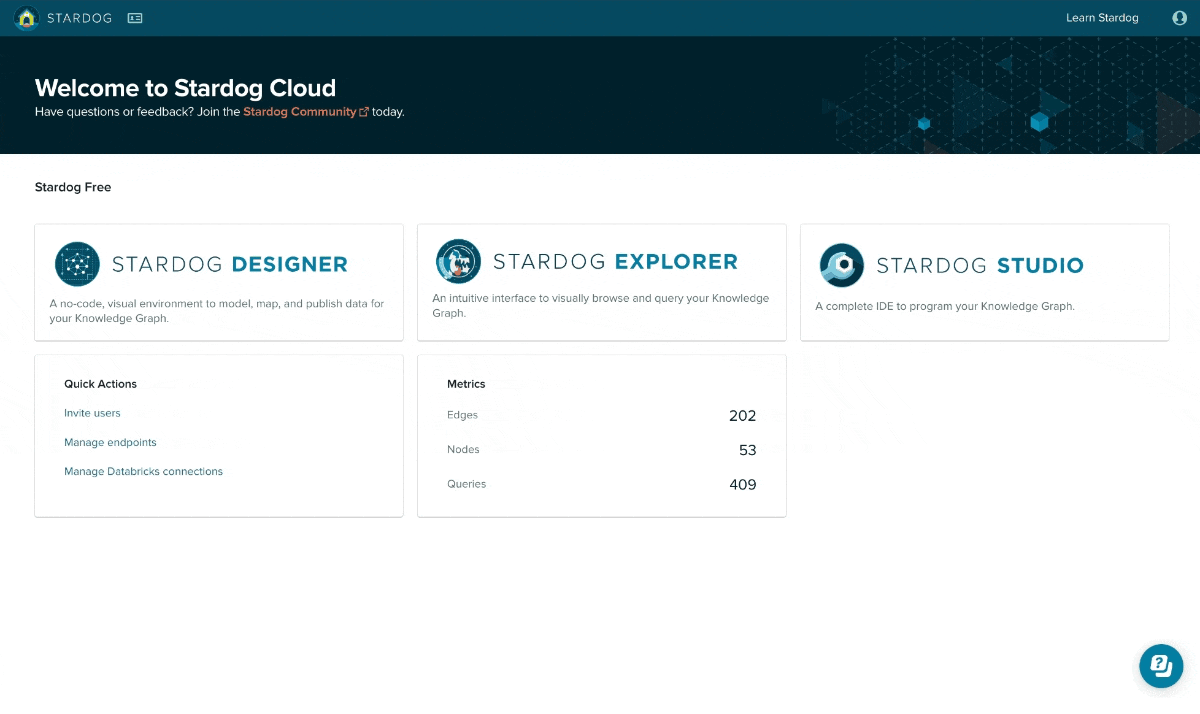
That’s why Stardog created Stardog Cloud: a complete Enterprise Knowledge Graph platform available straight from your browser, that includes a free learning environment.
This blog post will help you get started. You will:
- Understand the power of knowledge graphs and Stardog Cloud;
- Learn how to create a knowledge graph in four no-code steps;
- Learn how to visually browse and query your knowledge graph;
- Find out extra resources to make the most of Stardog Cloud.
Introduction: The Power of Knowledge Graphs and Stardog Cloud
How Knowledge Graphs Compare
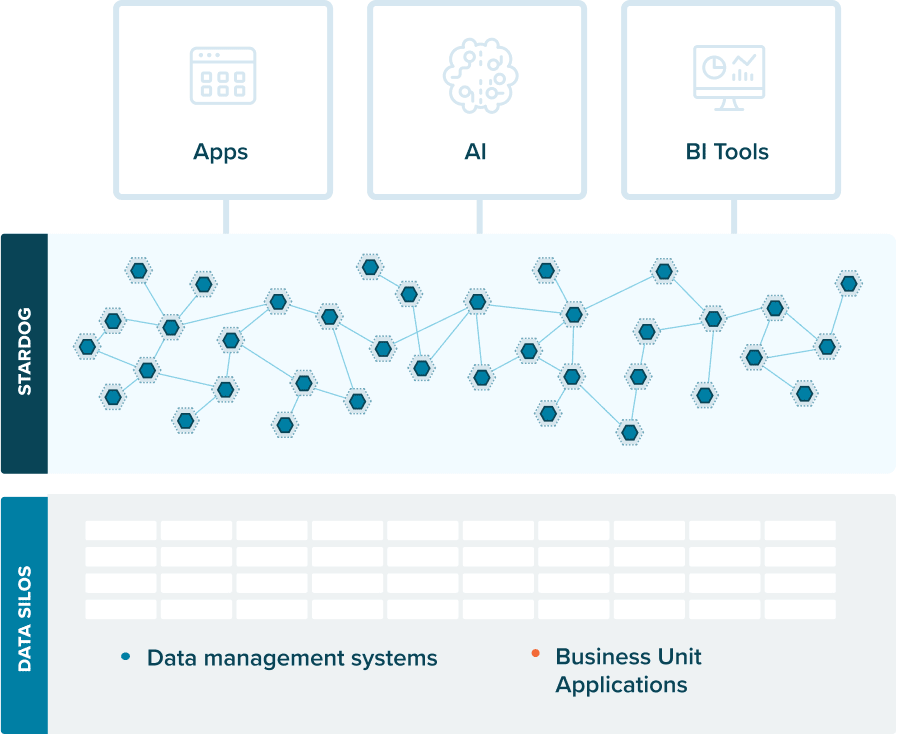
A knowledge graph is a flexible, semantic data layer that unifies and provides meaning to your data silos, with models that evolve as your data evolves. That’s how it enables you to answer complex queries and uncover hidden patterns better and faster.
As an example, let’s see how a knowledge graph can improve the query performance of a fictional company that uses three separate CSV files to record purchases and customers data:
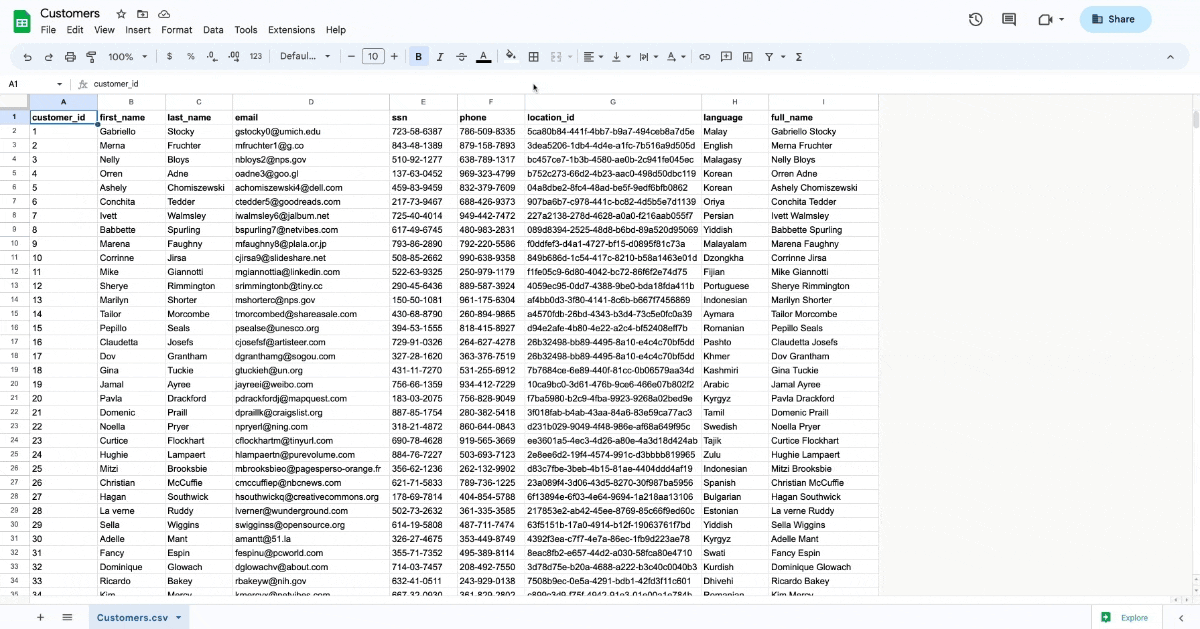
- Customers, with the fields
customer_id,first_name,last_name,email,ssn,phone,location_id,language, andfull_name; - Locations, with the fields
location_id,street_number,street_name,street_suffix,state,zip, andcity. - Purchases, with the fields
purchase_id,product_id,date,time,quantity,price,customer_id,card_id, andreward_account.
You can download the CSV files above by clicking here.
Now suppose that you need to find out the state of the customer who bought product 43.
Note that the file Locations (which informs the state) and the file Purchases (which indicates the product_id) don’t share any fields. So, without a knowledge graph, you would have to:
- Query Purchases to find the
customer_idof this purchase; - Query Customers to find out the
location_idof this customer; - Query Locations to find out the
stateof thislocation_id.
With a knowledge graph, however, you can query all files at the same time, because Customers connects the other two data sources: it shares the field customer_id with Purchases and the field location_id with Locations. So, in this case, your query can be as simple as this:

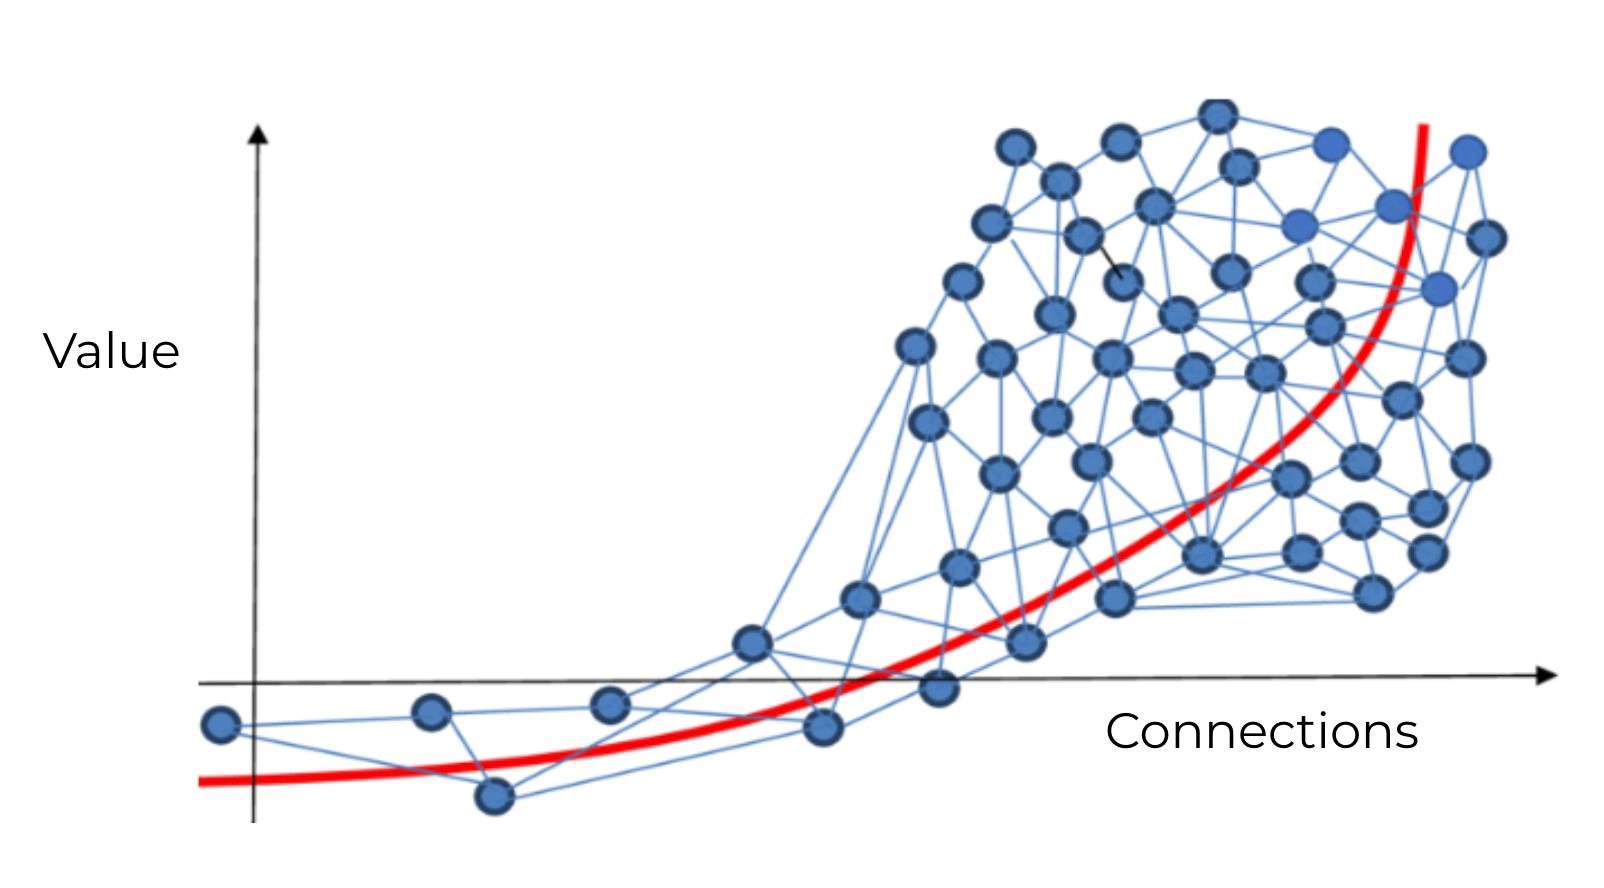
Even though the benefits of the example above are great, this is just a basic example of a possible use case. The more data sources and classes you have, the greater improvements you’ll get in your productivity:
How Stardog Cloud Makes Knowledge Graphs Easy
Stardog Cloud offers several demo and tutorial Knowledge Kits to help you at all levels of knowledge graph expertise.
You can, for example, query and browse industry-related demos or follow hands-on tutorials to master specific concepts, such as SPARQL and Machine Learning.
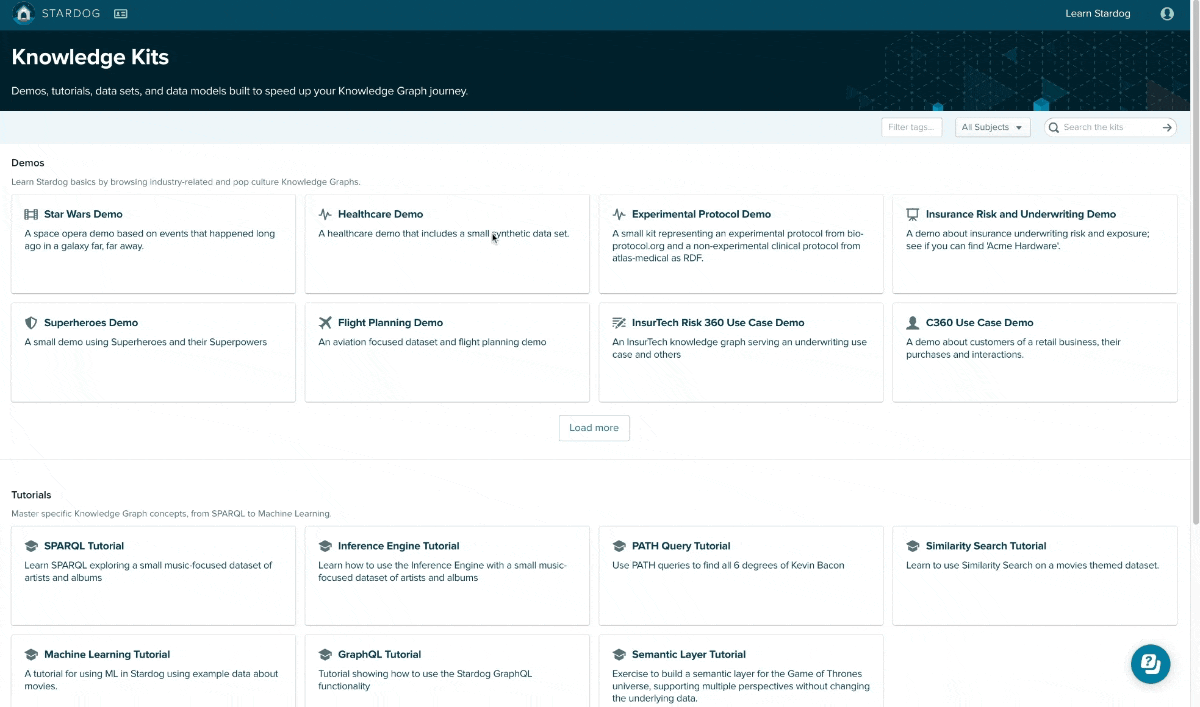
Several additional resources are included in Stardog Cloud to accelerate your learning curve, including checklists with step-by-step walkthroughs, an in-app search box to explore Stardog’s documentation, and a dedicated Stardog Community.
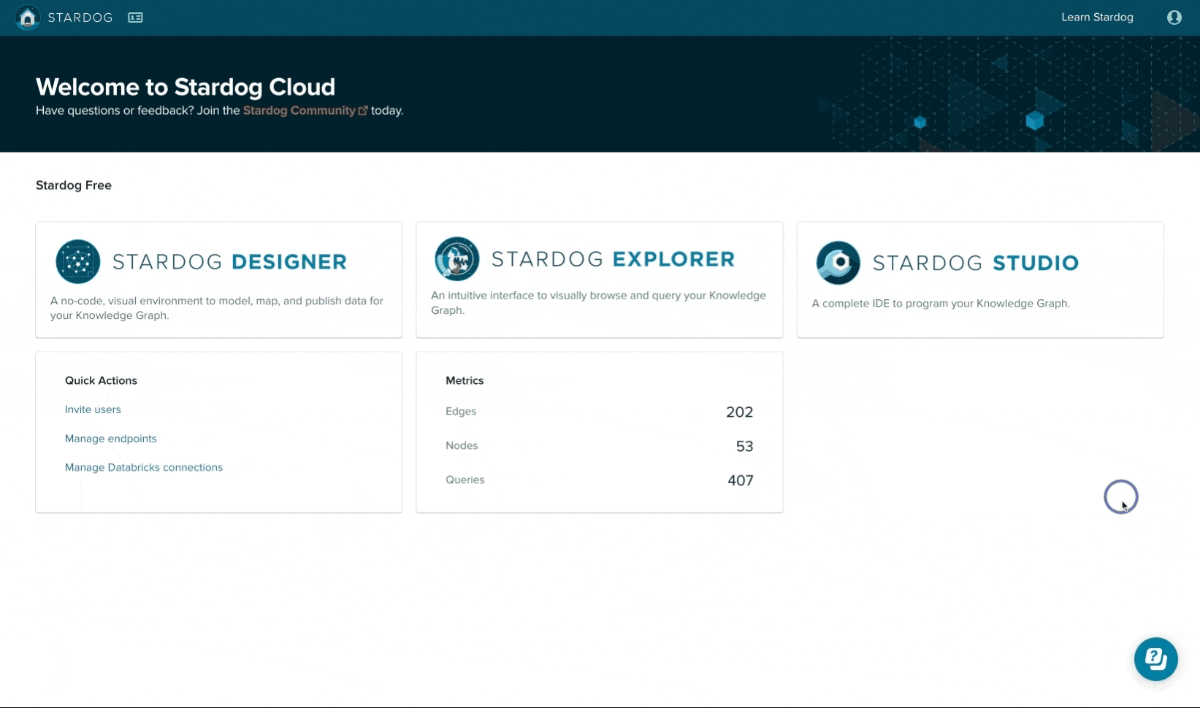
And, most importantly, Stardog Cloud offers full access to the three Stardog Applications:
- Stardog Designer, a no-code, visual environment to model, map, and publish data for your knowledge graph;
- Stardog Explorer, an intuitive interface to visually browse and query your knowledge graph;
- Stardog Studio, a complete IDE to program your knowledge graph.
In the following paragraphs, you will learn how to use Designer and Explorer to create, browse, and query your knowledge graph with ease.
Guide 1: Create a Knowledge Graph in 4 No-Code Steps
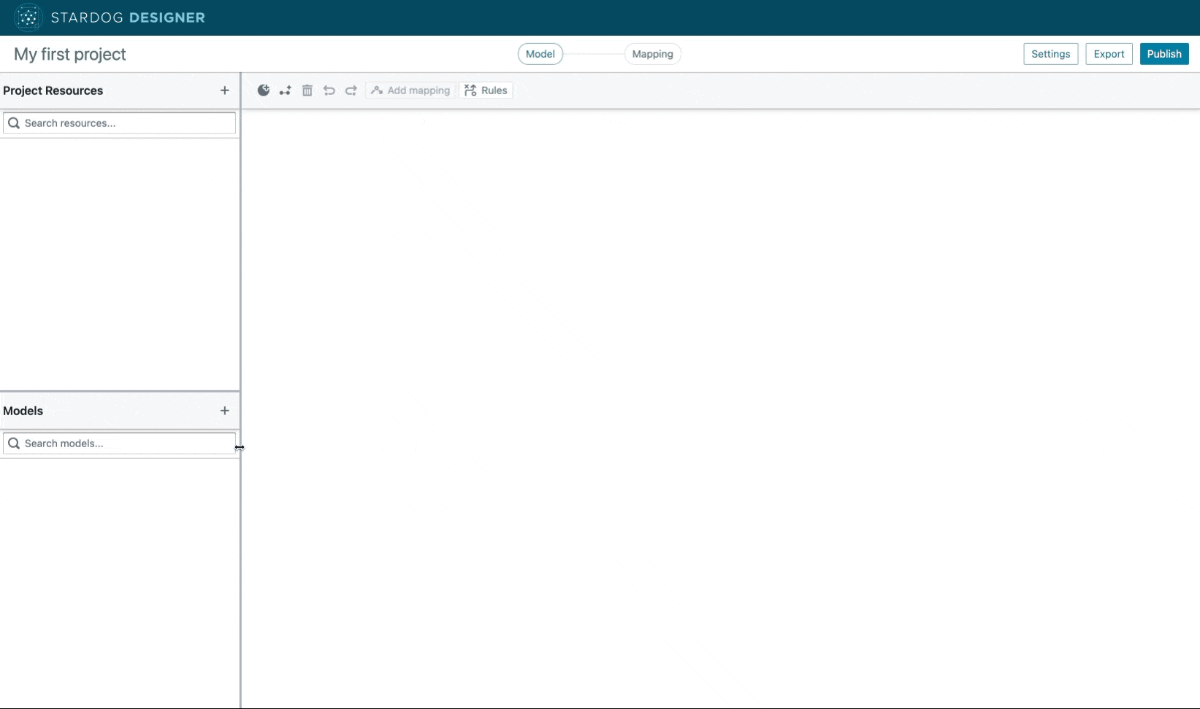
1. Creating your project
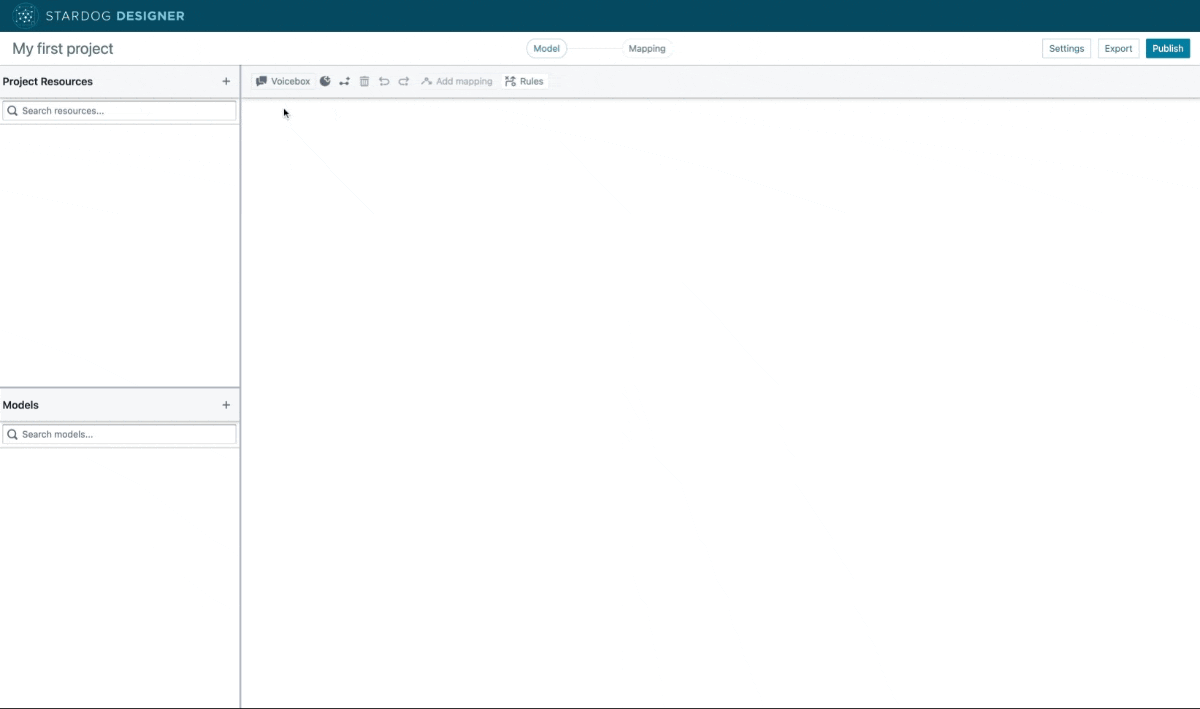
Stardog offers free Knowledge Graph endpoints to be used as learning environments. After creating your Stardog Cloud account and claiming yours, select Designer.
Then, name and create your first project.
Tip: choose a name that is descriptive of your use case and as precise as possible. The project name will be used to identify the knowledge graph model.
If you have installed a Knowledge Kit or created a previous knowledge graph, you can start by adding a model to your project. In this exercise, however, we will start from scratch.
2. Adding and mapping project resources and classes
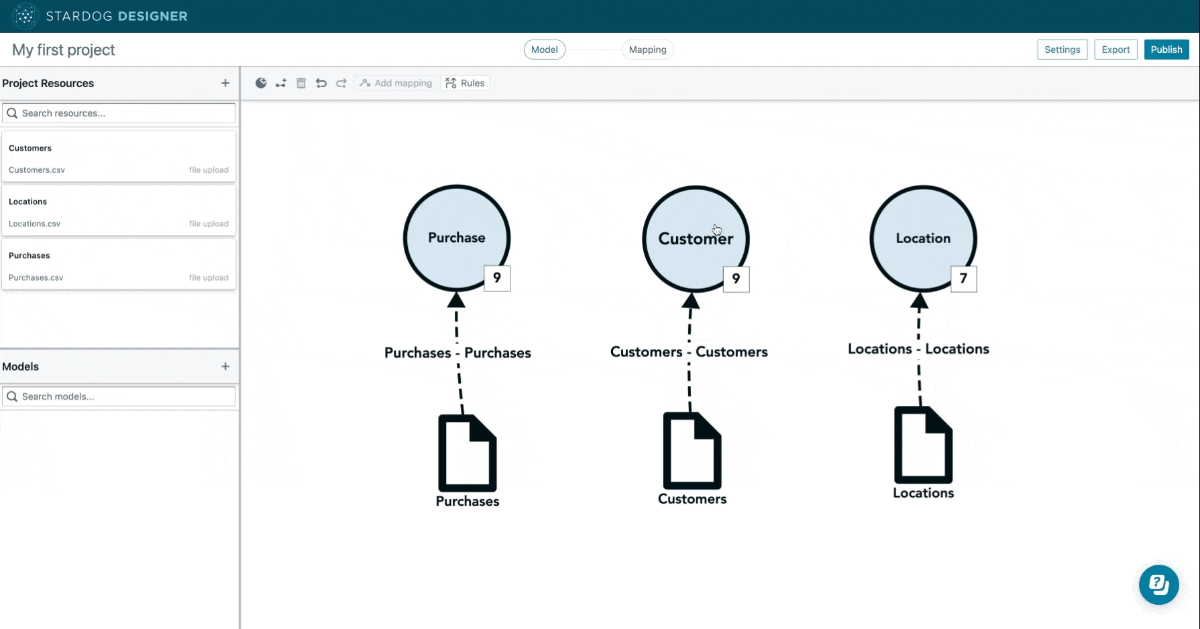
Let’s get started by adding the three CSV files from our fictional company as our project resources.
Tip: project resources are the data sources of your knowledge graph.
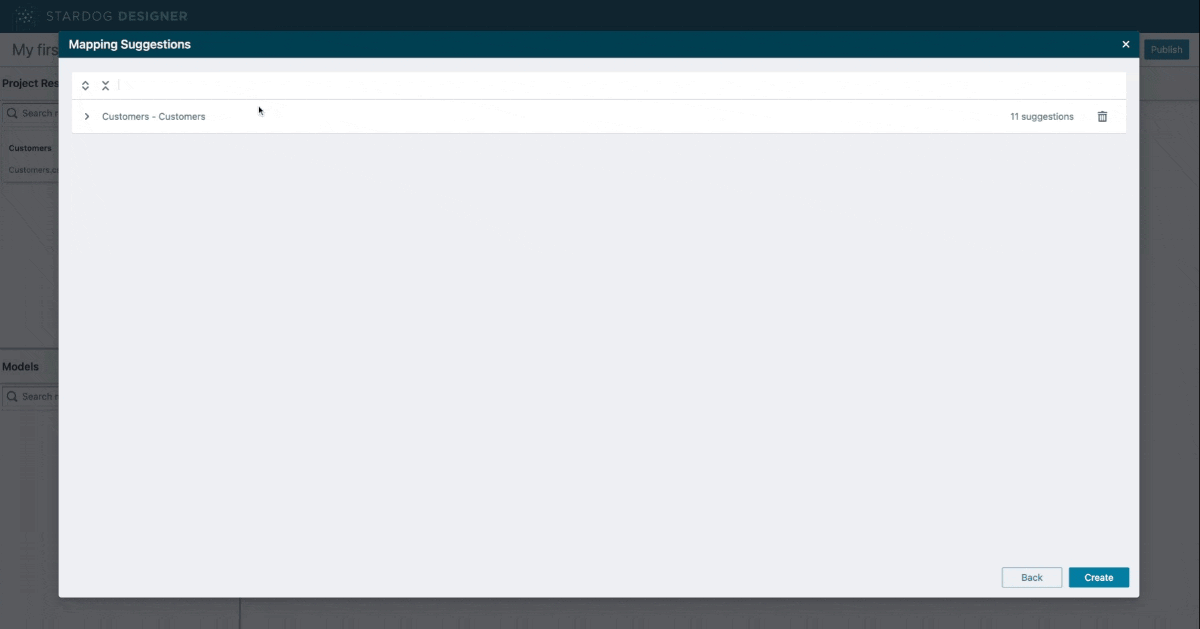
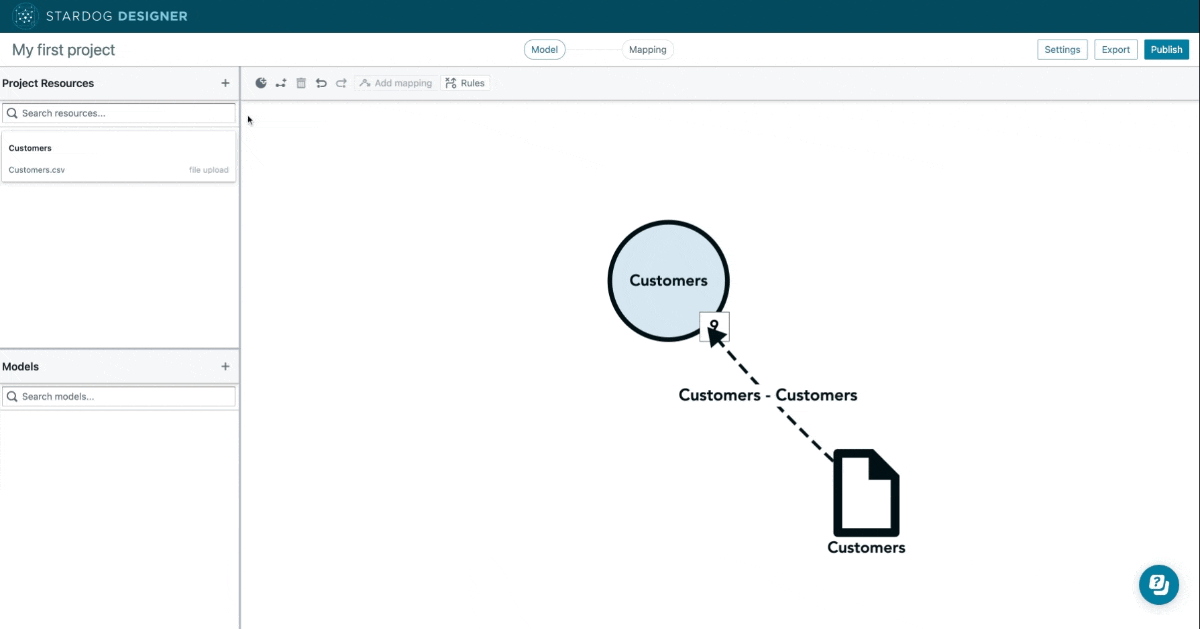
After clicking on “+ Project Resource”, select “Browse Files” and upload your first CSV file. In this example, we will start with Customers. Note that you can customize the resource name, properties, and headers. When finished, click on “Create and Map”.
Tip: mappings connect your project resources’ data to your graph’s concepts.
Designer will suggest a class for your model (in this case, Customers), a primary identifier (in this case, customer_id), a label, and its attributes. Click on “Create” to accept them.
Tip: classes represent categories of instances with similar characteristics (e.g. Customers), and primary identifiers serve as reference points to make them searchable and connectable to other classes.
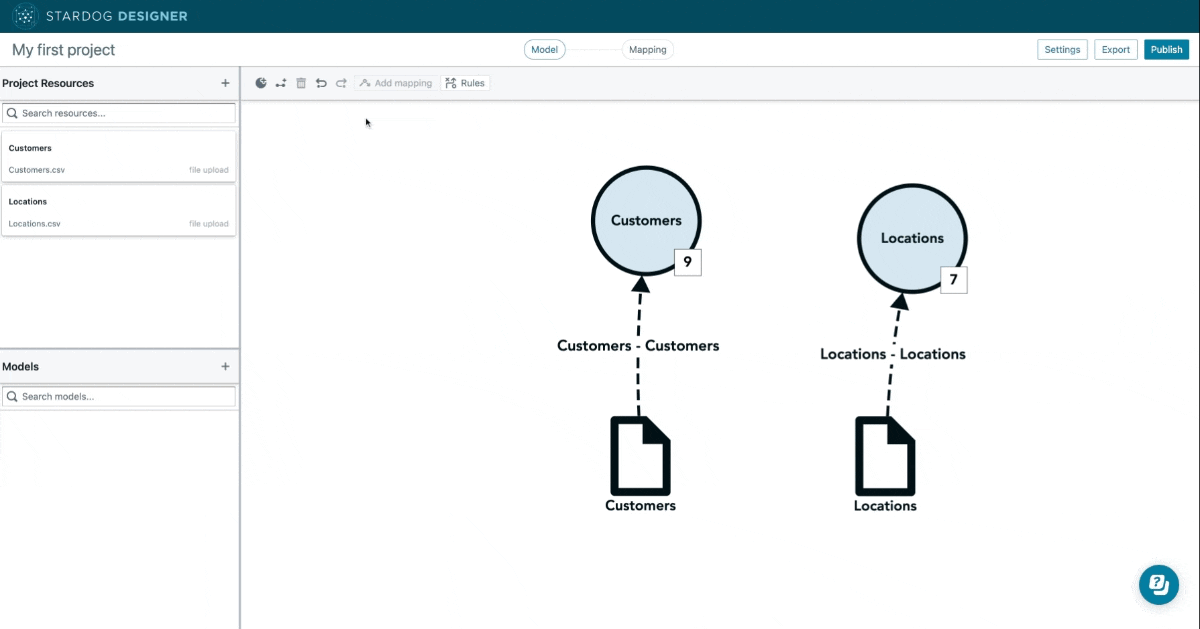
Then, we will import the second file (Locations) and click on “Create and Map”.
Since the model already has a class (Customer), Designer will give the option to use it on this mapping. But, since we want to create a second class, we will click on “Next” to make Designer suggest a new class.
In this case, the proposed class is Locations and the primary identifier is location_id.
Tip: you can drag and drop the elements on our canvas in your order of preference.
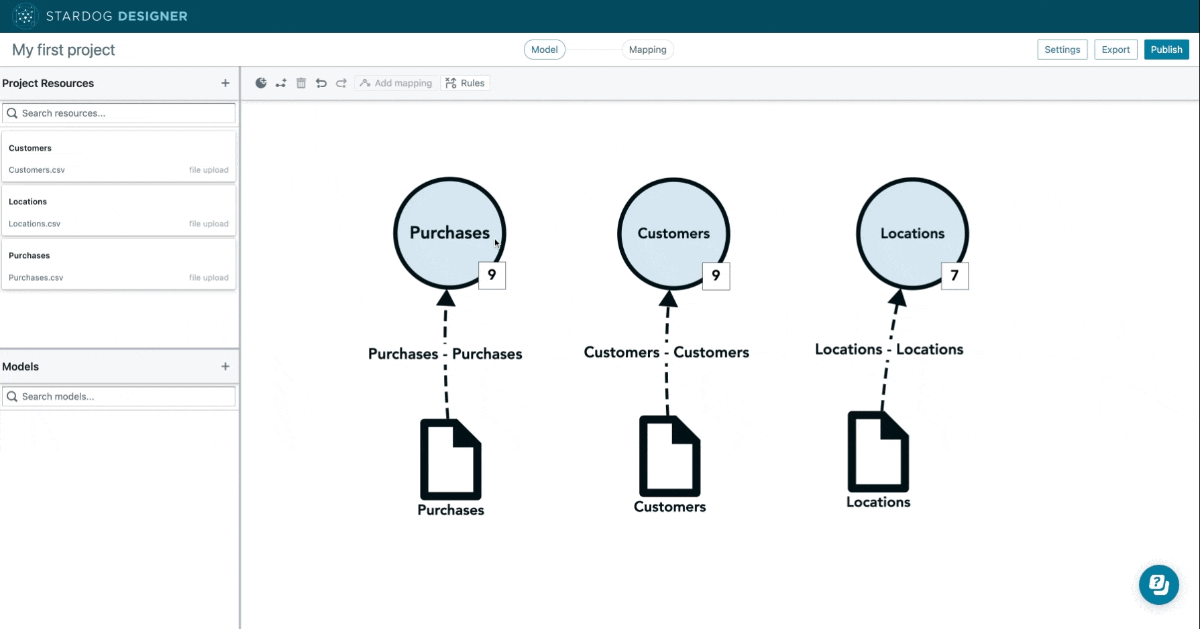
We will then upload the last file (Purchases) and go through the same steps.
Note that Designer allows you to edit classes, attributes, and mappings. Let’s change the classes from plural to singular, for example, naming them Customer, Purchase, and Location:
You can also edit the labels of your knowledge graph by clicking on the mappings between project resources and classes and then switching to the “Mappings” view.
Tip: labels define how instances will be displayed throughout Stardog Cloud. When no label is set, the instance label will be the same as the primary identifier.
As an example, let’s set the attribute state as the label of the class Location:

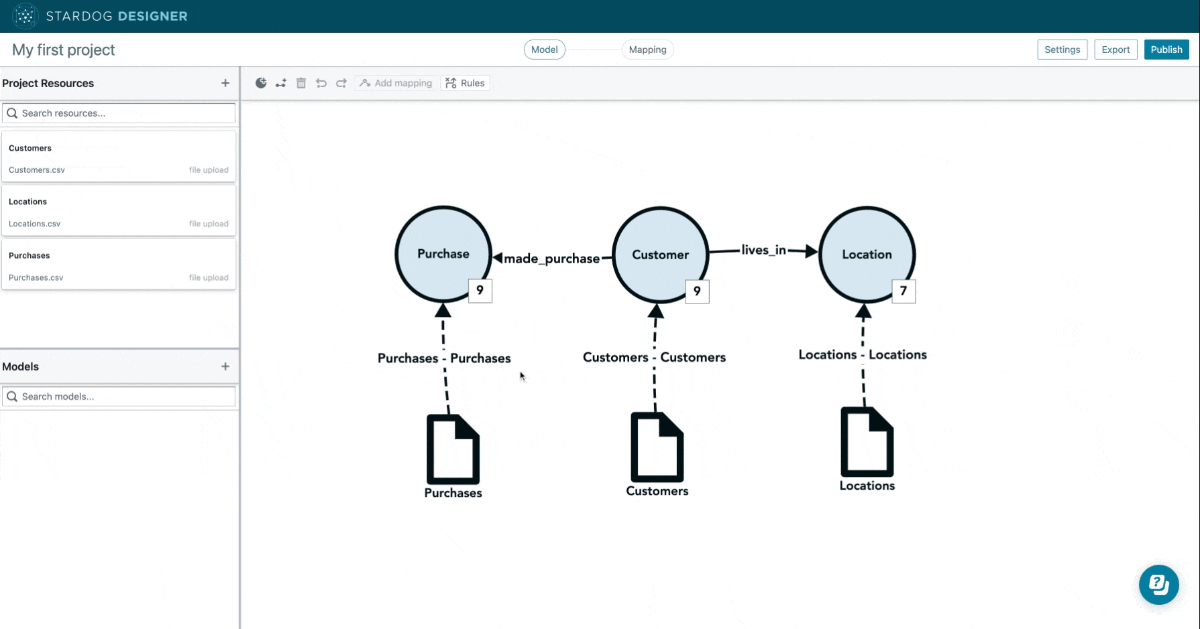
3. Adding relationships
Now it’s time to define the relationships between these classes.
Tip: relationship is the semantic explanation of the connection between two classes.
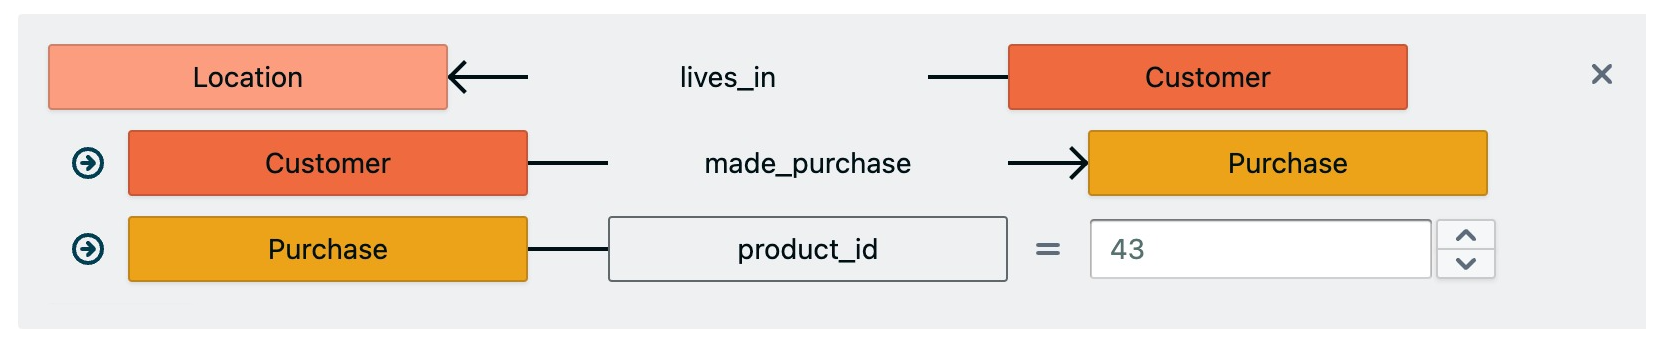
Here, we will add the relationship made_purchase between the classes Customer and Purchase and the relationship lives_in between Customer and Location. To do that, we will select the source class, click on “Add relationship”, define the target class, and click on “Create”.
4. Mapping relationships
We will now map the project resources to the relationships, as we have done with the classes.
In this case, we need to connect a project resource that contains unique identifiers for both the source and target classes of the relationship, so they can get connected.
Here are the fields of our three project resources:
- Customers, with the fields
customer_id,first_name,last_name,email,ssn,phone,location_id,language, andfull_name; - Locations, with the fields
location_id,street_number,street_name,street_suffix,state,zip, andcity. - Purchases, with the fields
purchase_id,product_id,date,time,quantity,price,customer_id,card_id, andreward_account.
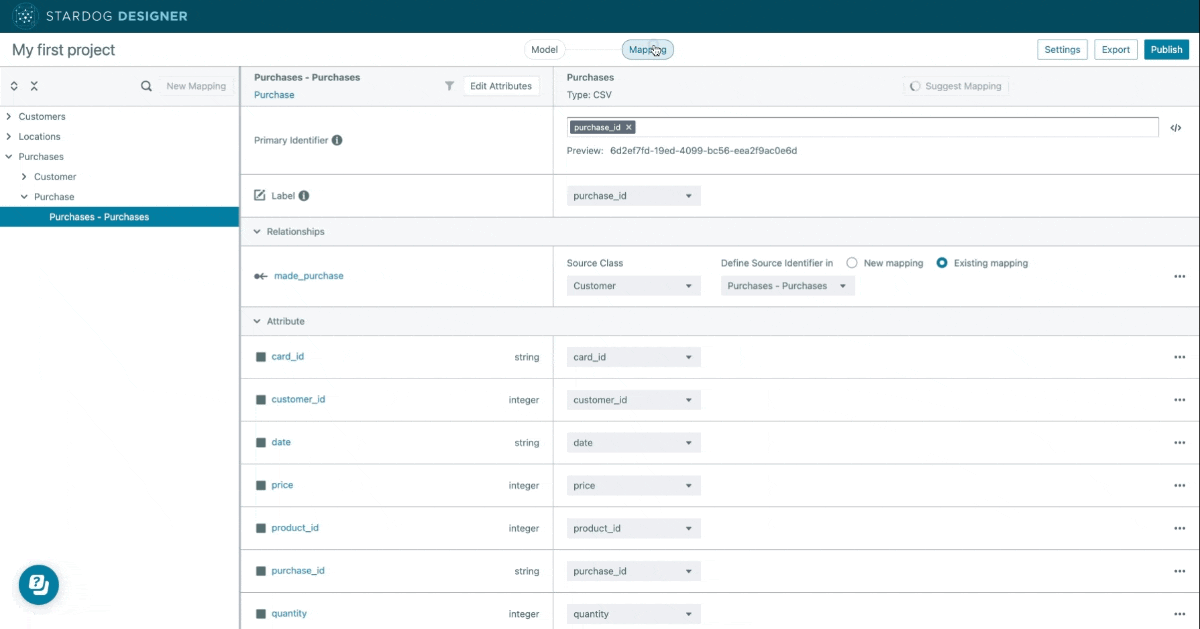
Based on their fields, we can map the relationship made_purchase with the resource Purchases, because it can connect to both classes involved in this relationship: customer_id is an attribute of the class Customer and purchase_id is an attribute of the class Purchase.
To do that, select the mapping “Purchases - Purchases”, then toggle to the Mapping view, set the source class to Customer, and the source primary identifier (in new mapping) to customer_id.
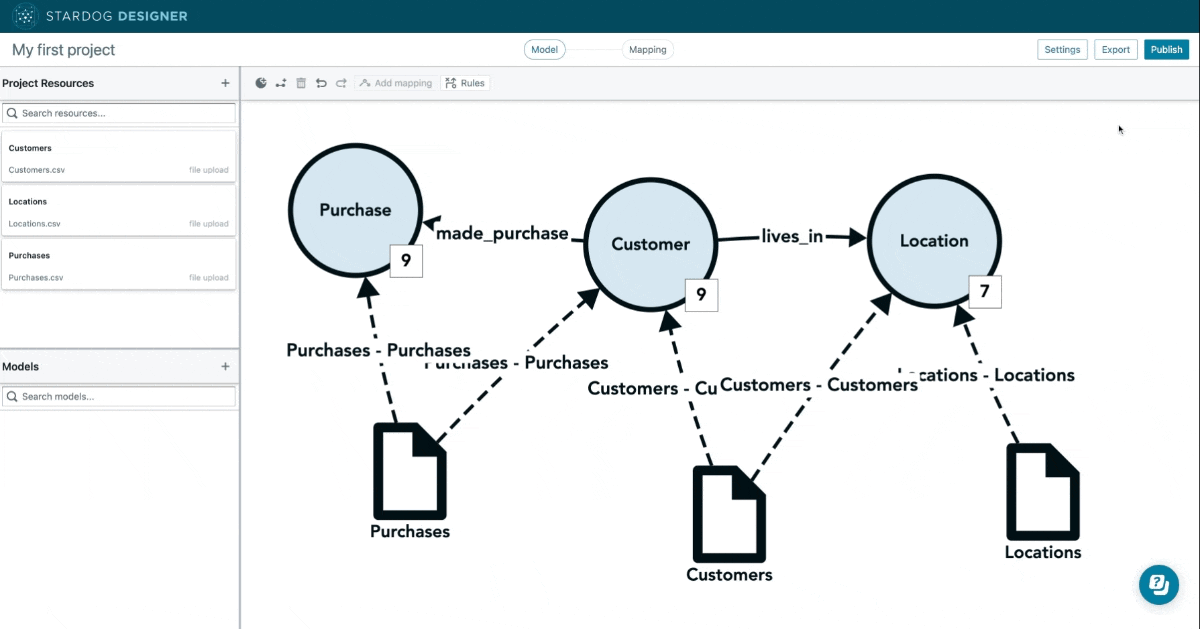
Let’s switch back to the “Model” view and do the same with Customers-Customers, by mapping it to the target class Location in lives_in (primary identifier: location_id).
5. Publishing your project
Switching back to the “Model” view, we can now see that all classes are mapped with our project resources. That means it’s time to publish our knowledge graph!
To do that, click on “Publish”, select or create a database, create a new model, and finish the process. You’ll also find other publishing options that cover other use cases.
Guide 2: Visually Browse and Query Your Knowledge Graph
1. Browsing your data
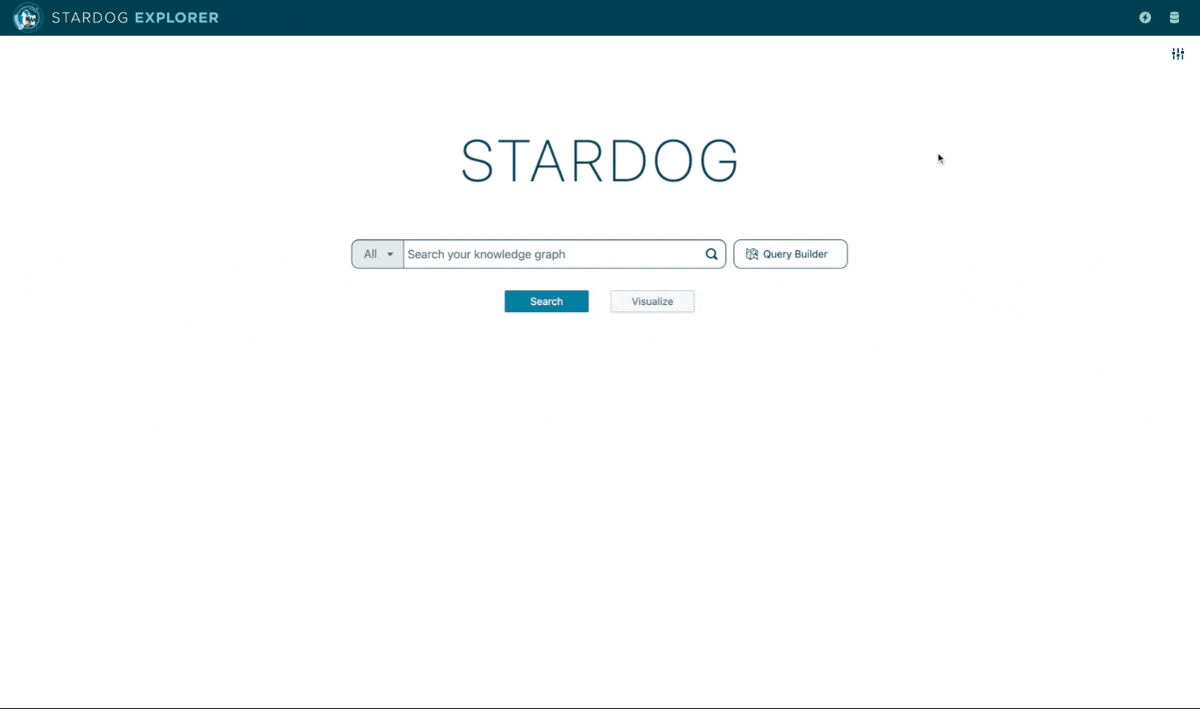
After publishing your knowledge graph in Designer, Stardog Cloud will make it available in Explorer immediately. In Explorer, you will find an intuitive interface to browse and query your data.
To get started, select Explorer on the Stardog Cloud homepage and then the database into which you have published your knowledge graph.
Then, you’ll be able to search your knowledge graph or visualize your model. Let’s start by searching for “Marilyn Shorter” - an instance of the class Customer - and double-clicking it to expand its relationships.
You can expand grouped instances with a single click and see the details of each instance with a right click. To switch between “List” and “Graph” views, use the icons in the upper-left corner.
2. Querying your data
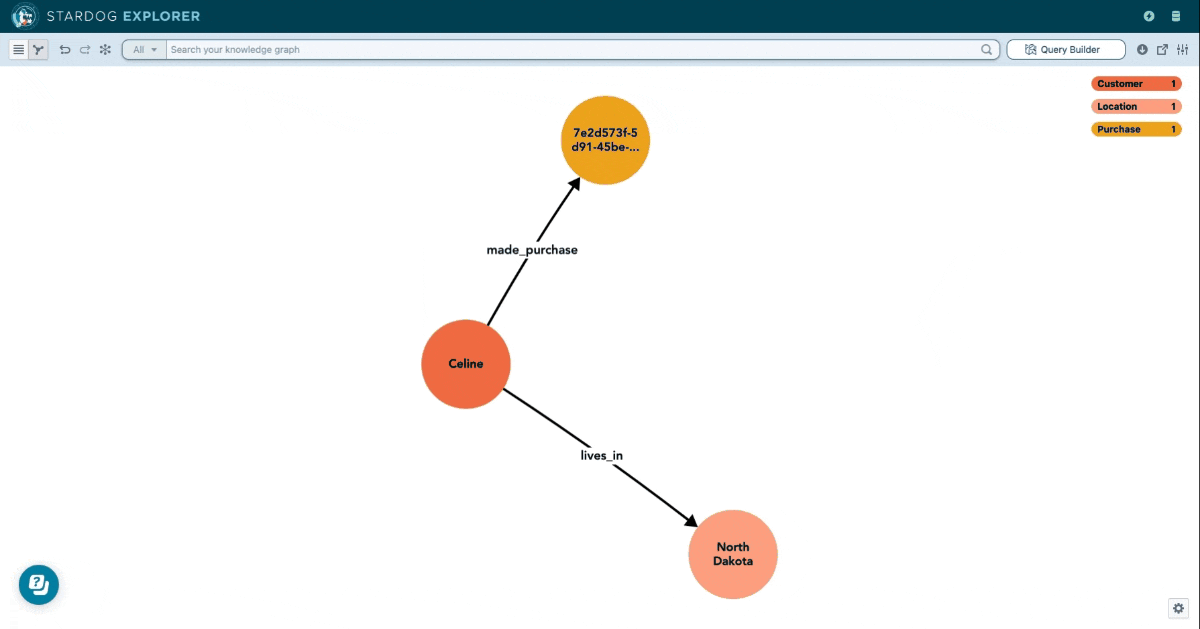
Now let’s go back to our initial goal: find out the state of the customer who bought product 43.
To do that, we will use Query Builder, a no-code tool that allows you to visually uncover insights based on classes, relationships, and attributes, located to the right of the search bar.
In Query Builder, we will search for the Location related to the Customer whose Purchase has the attribute product_id set as 43:
By running this query, you will easily find the state “North Dakota”, as well as the customer (Celine Bastiman) and the purchase related to product 43.
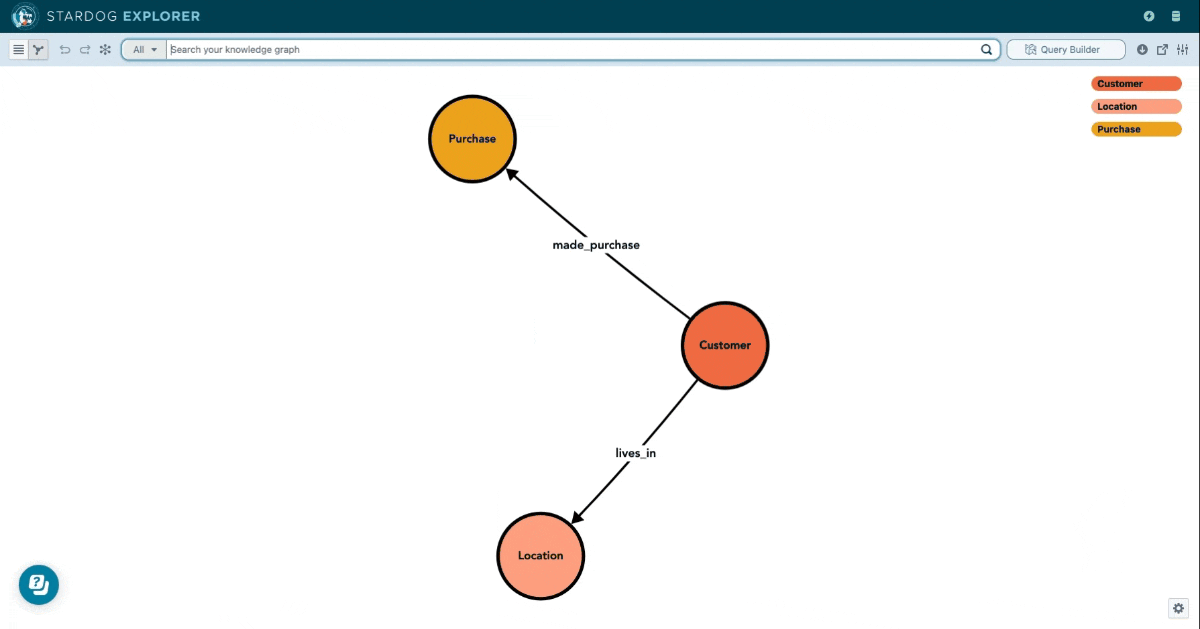
You can also see the details and expand the relationships of all the instances returned by your query by right-clicking them:
Bonus: Extra Resources to Make the Most of Stardog Cloud
Creating your first knowledge graph is just the beginning! Here is a tease of other great features you’ll find in Stardog Cloud:
1. Inference rules
Designer makes it easy for you to add inference rules to your knowledge graph. Insurance companies, for example, can infer the relationship Owes between Customers and Taxes when they are both related to the same Vehicle by the relationships Drives and Taxes for:
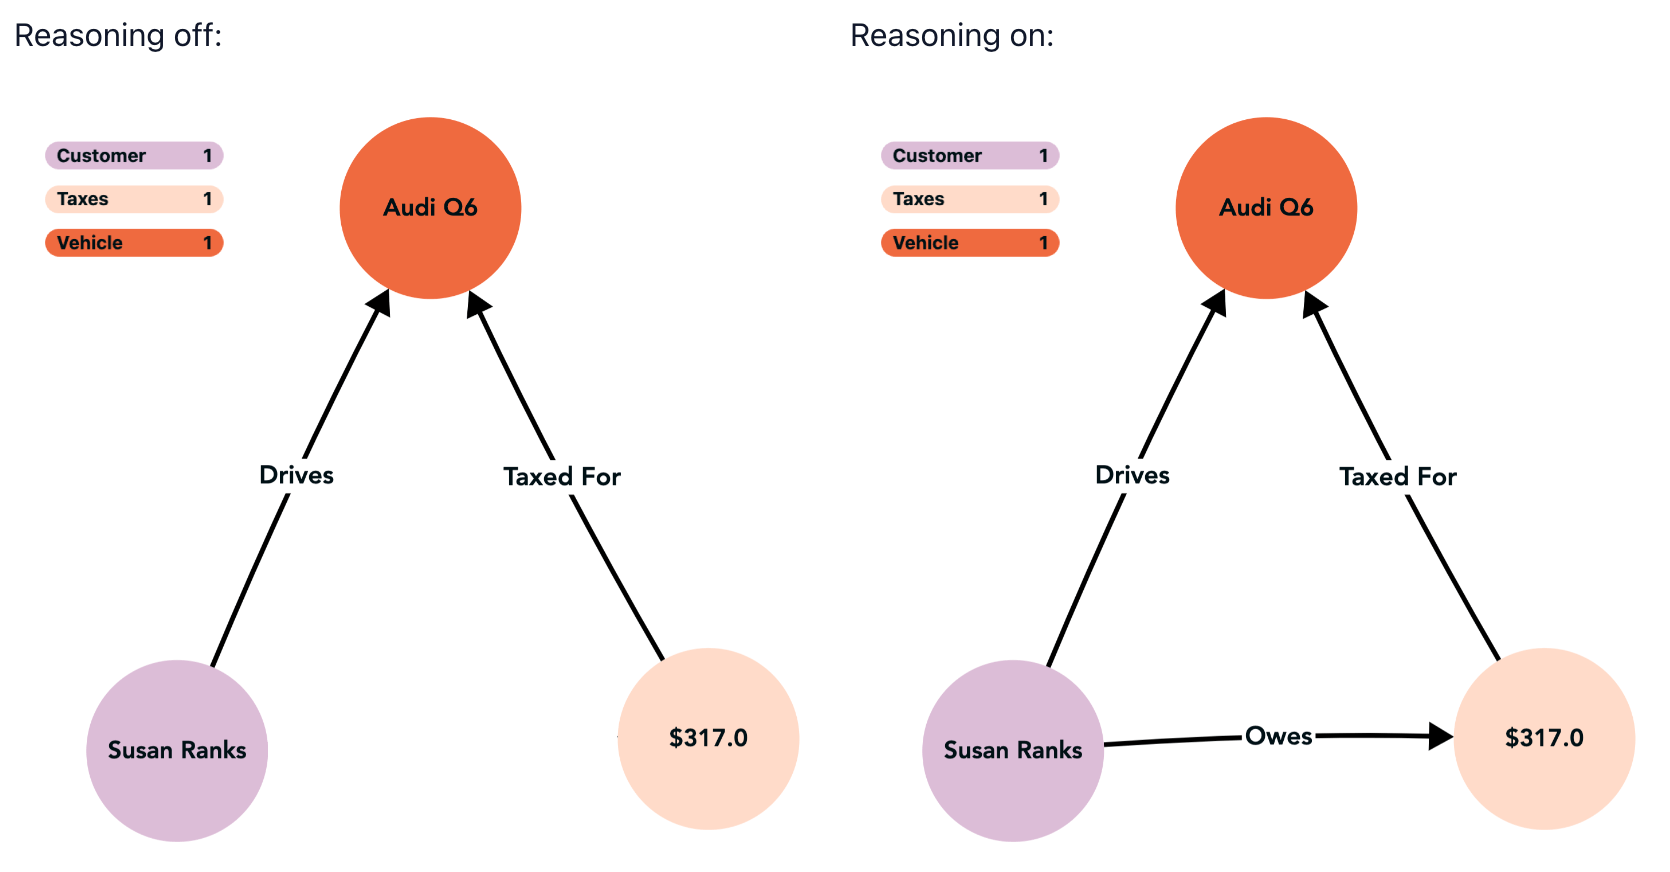
After creating no-code inference rules in Designer, you can visualize inferred data in Explorer by enabling reasoning in your knowledge graph settings.
2. Virtual Graphs
With Virtual Graphs, you can access databases from Databricks, MySQL, PostgreSQL, Snowflake, and others even without copying that data into Stardog Cloud.
That means you won’t have to wait for long, costly data preparation and migration processes and will always get the most up-to-date results every time you query your knowledge graph.
3. Stardog Studio
Stardog Studio is a complete IDE (Integrated Development Environment) created for data engineers to program knowledge graph, with support for SPARQL and GraphQL queries.
4. Stardog Voicebox (teaser)
Shortly, Stardog Cloud will receive a great addition: a conversational AI assistant called Stardog Voicebox.
Voicebox will make it even easier for you to create and manage projects in Designer and query them in Explorer, revolutionizing the accessibility of knowledge graphs forever.
Stay tuned to learn more about Stardog Voicebox and, meanwhile, don’t forget to create your free Stardog Cloud account to get better insight faster today.
