Query Knowledge Graphs with Billions of Triples in Less Time Than It Takes to Read This Headline About Performance Benchmarks

Get the latest in your inbox

Get the latest in your inbox
As we’ve said before, we don’t need any particular input from customers to know that they’d like every query they send to Stardog to be executed faster in every new release. We just assume everyone wants Stardog to always get faster.
Stardog recently refreshed its Starbench report, which contains a comprehensive set of performance metrics, including some benchmarking data in comparison with a Commercial RDF Graph Database. (Note: The graph database in question prohibits us from identifying it in benchmarking reports.) That 15-page report is now available. Since we’re all about speed, let’s summarize the findings now, starting with a brief overview of our benchmarking protocols.
The benchmarks we most recently performed were against Stardog 9.0.1 over a wide range of datasets and workloads. We used public datasets and benchmarks: BSBM (Berlin SPARQL Benchmark), LUBM (Lehigh University Benchmark), LSQB (Labelled Subgraph Query Benchmark) from LDBC, YAGO (Yet Another Great Ontology), and Wikidata. Where available, we followed predefined benchmarking protocols.
The benchmarks cover transactional queries (read and update) over local and virtualized graphs, reasoning queries, path queries, and bulk loading, and they measure the impact of concurrent users on the overall system, including Stardog’s High Availability cluster. We present both latency and throughput metrics for these benchmarks. We also compare the performance of Stardog 9.0.1 with a Commercial RDF Graph Database where applicable.
We present the detailed results for each benchmark in the aforementioned report, along with the configuration details and parameters used during the benchmarks. All the scripts used for testing are available upon request to reproduce these results independently.
On to the results.
First, let’s talk about performance when you are trying to load large amounts of data. These operations are done automatically behind the scenes and include creating a database and pulling data from virtual graphs or data files into a local Stardog node or into a cache node.
Our benchmarking, on commodity hardware, shows that we can load billions of triples at one million triples per second.
Stardog achieves this throughput across BSBM and LUBM datasets with the c5d type of Amazon Elastic Compute Cloud (EC2) instances, which are CPU-optimized with local NVMe SSDs. A half-million triples per second loading speed can be achieved with significantly less expensive machines such as those in the c5 and r5 family of instance types.
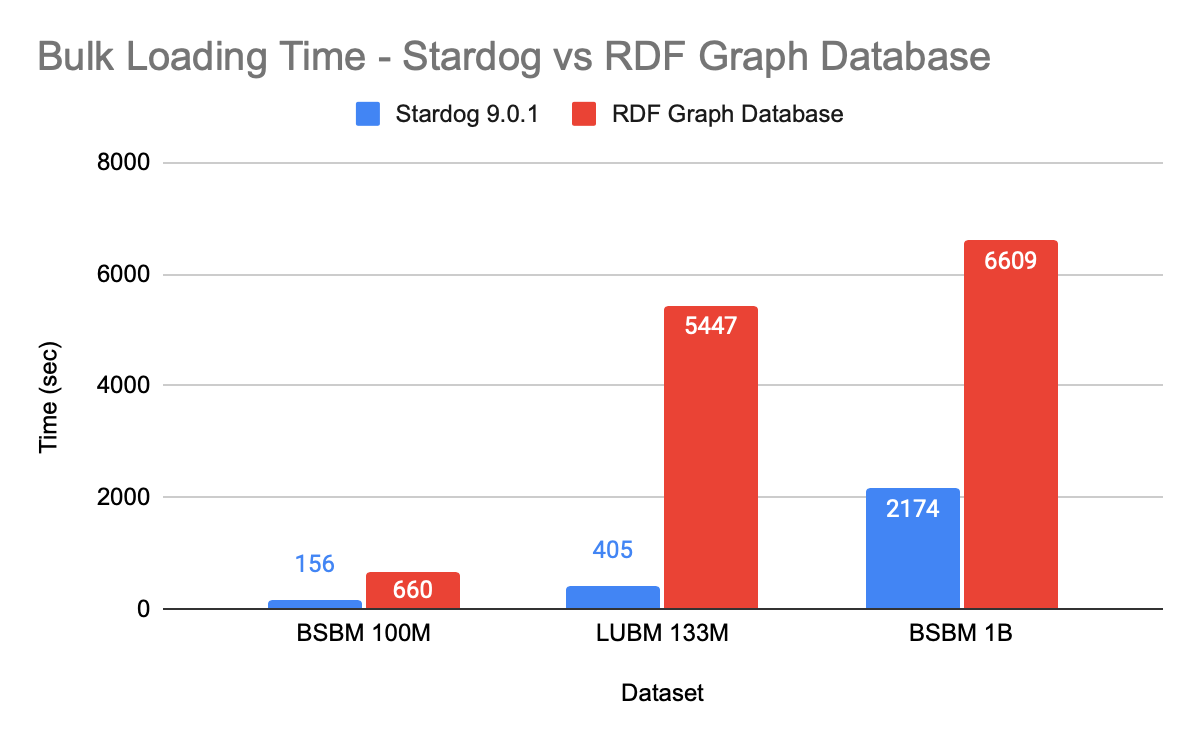
Comparing the loading times of Stardog and the Commercial RDF Graph Database on r5.2xlarge instances with identical memory settings, Stardog is 3 to 4 times faster loading the BSBM dataset and more than 10 times faster for the LUBM dataset:

Why is the difference so great for LUBM? Reasoning is required to answer the queries correctly in the LUBM benchmark (otherwise, you get missing results), so we enabled reasoning for the Commercial RDF Graph Database. With that database, reasoning is done at data-loading time. That takes time, while Stardog loads data without that additional processing and instead draws inferences at query time (more on that next).
To make the comparison as fair as possible to the Commercial RDF Graph Database for the BSBM benchmark, which doesn’t require reasoning, we disabled reasoning for that database while loading the data to allow it to get the best performance possible; still, we saw the 3-4x performance factor in favor of Stardog.
Let’s assume you didn’t load data for the inherent fun of it, but for the fun of querying it. Let’s also assume you’re updating the data at the same time.
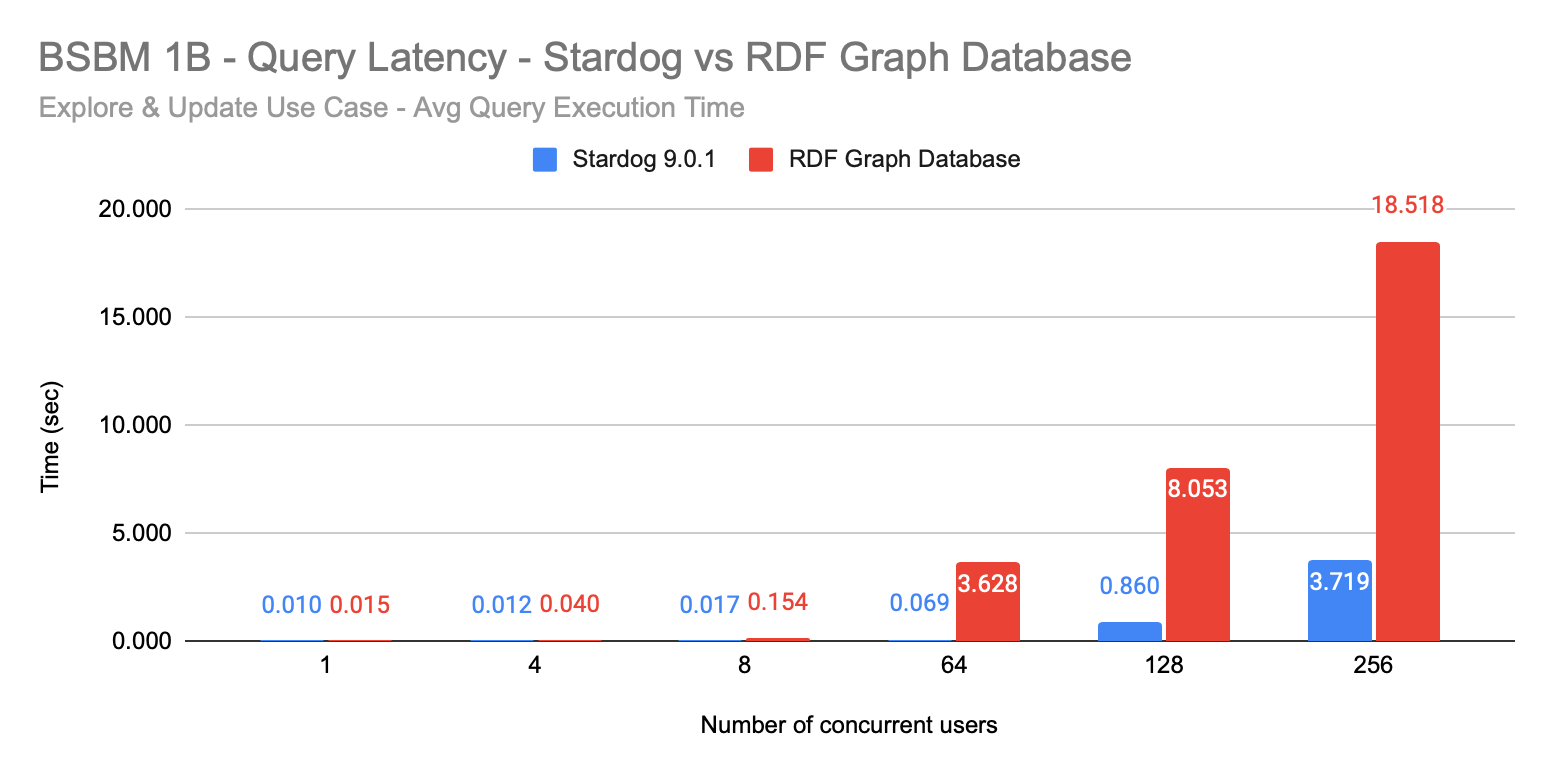
BSBM is a great benchmark for that: one billion triples about products; products with features, hierarchies, offers, vendors, and reviews. In the real world, you might be trying to find information about products while offers are added or removed and new reviews are coming in, so this is a compelling test to run in a lab. During this benchmark, you also change the number of concurrent users in the system, as is likely to happen in an enterprise.
Our results were an average query execution time ranging from only 10 milliseconds with a single user to 69 milliseconds with 64 concurrent users. On the same hardware, the Commercial RDF Graph Database we compared ourselves against took 50 percent longer for a single user at 15 milliseconds, and the gap widened from there, with a 3.628-second response when there were 64 concurrent users. That’s a 50x difference:

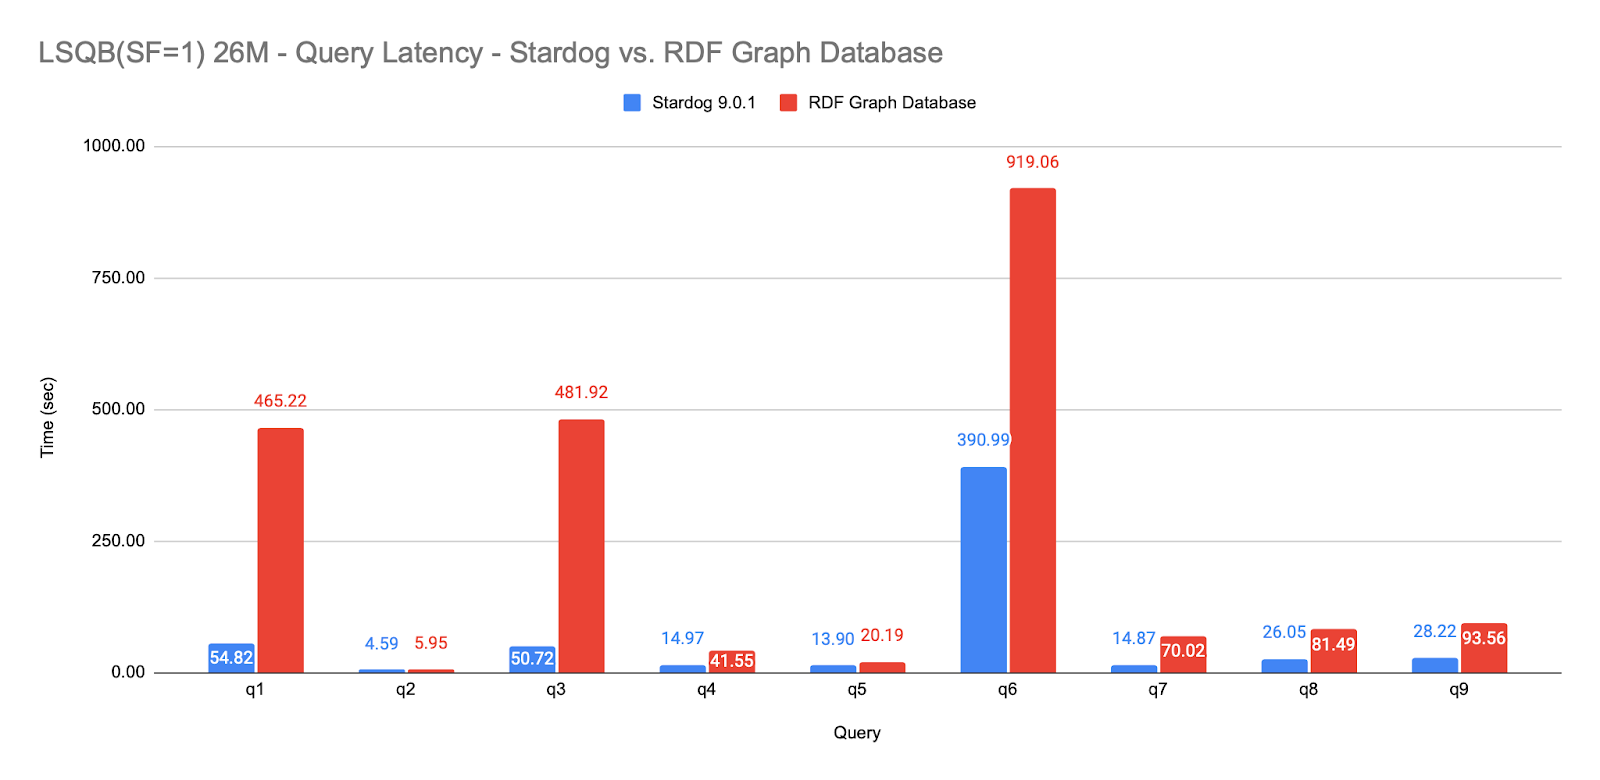
We also tested Stardog’s performance against the LSQB benchmark, which requires a query engine to process large amounts of patterns for complex queries that traverse a dataset of social networks. Stardog outperforms the Commercial RDF Graph Database for every query in the benchmark and, for the majority of the queries, by a factor of 3x to 9x:

Back to LUBM, which tests the performance of reasoning queries over an ontology, not just queries over explicit data.
One would expect that if the database we compared ourselves against is spending 10 times more time at data loading, it must be much faster answering reasoning queries, but that’s actually not the case. Stardog reasoning performance is very nearly as good as systems that compute inferences at data load time and materialize them upfront. For the queries where the comparison database is faster, the difference is typically a few milliseconds—not large enough to justify the 10 times difference in data loading speeds. You can find the more detailed analysis of LUBM queries in the full report.
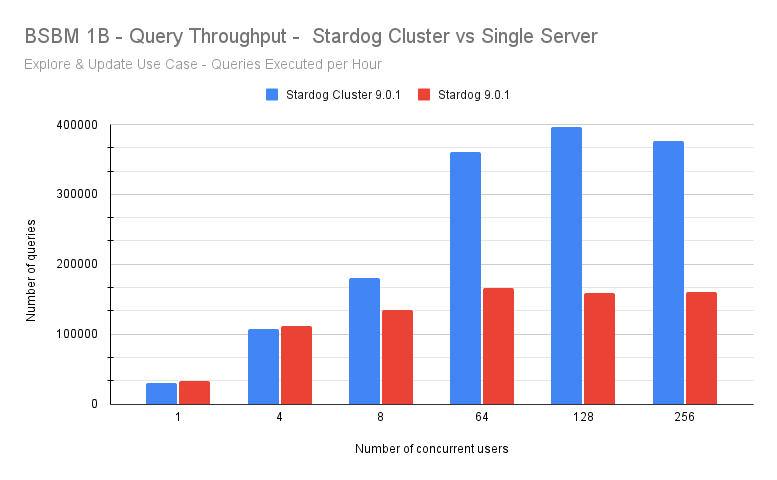
We tested a Stardog high-availability cluster with three nodes to benchmark scalability and load-handling. A Stardog cluster is a collection of Stardog servers running on one or more virtual or physical machines behind a load balancer that, from the customer’s perspective, behave like a single Stardog endpoint.
A three-node Stardog cluster improves query latency 8 to 10 times compared with a single Stardog endpoint at high levels of user concurrency. Query throughput is improved by 2.5 times with the three-node cluster:

There’s more in the report, including results from other benchmarks and datasets. For example, Stardog can complete the Wikidata Graph Pattern Benchmark against 16.7 billion triples with query execution times under 100 milliseconds for 92% of the queries and under 1 second for 99% of the queries in the benchmark. For the YAGO2S benchmark, which checks the performance of property paths, Stardog’s average query execution times are extremely low, with the hardest query taking slightly more than 300 milliseconds.
And, as previously reported, Stardog can scale to 1 trillion triples by utilizing virtual graphs in a hybrid multi cloud setup with query answering times of 1 second or less, even for queries that require reaching out to multiple data sources. The Stardog setup is 98% cheaper to run than the only competitor who could reach this scale.
If it’s been a while since you’ve explored the Stardog platform, it might be time to jump back in. Besides being performant in data loading and querying, it’s never been easier to get started.
How to Overcome a Major Enterprise Liability and Unleash Massive Potential
Download for free