As the value of technology shifts from applications to data, the upside of becoming a data-informed enterprise is huge. The more data you collect, the more your products and services improve, attracting more customers and deepening relationships with those you already have. But after more than two decades of collecting, storing, analyzing, and reconfiguring troves of information, are organizations really getting the value they expect from their investments in Big Data?
The answer, according to an Accenture Research study of the issue, is no. Many firms still struggle to harness the power of data. Their survey revealed that only 32 percent of companies reported being able to realize tangible and measurable value from data. In comparison, only 27 percent said data and analytics projects produce insights and recommendations that are highly actionable.
Further, according to Forrester research, between 60 percent and 73 percent of all data within an enterprise goes unused for analytics. For example, The Future of Retail Revenues Must be Data Led study conducted by Forrester Consulting found “85% of grocery retailers lack capabilities, technology, and expertise to use insights to monetize their data and drive customer experience.”
To solve the problem of the proliferation of data (particularly semi or unstructured data) and rigid data management approaches, McKinsey & Company advocates organizations invest in flexible, integrated data stores of ready-to-use data that include the use of “flexible ontologies and knowledge graphs to map the relationship between different classes of data and data points” to develop data products faster such as customer 360 and enable sophisticated analytics.
Bold new approaches, Internet-scale technology
The good news is that there is a fast-growing, newer cadre of startups addressing these challenges by connecting data and delivering analytics solutions. Due to the inability to deal with the complexity of accelerating data analytics competency to gain a competitive advantage, many enterprises are quickly turning to innovative companies such as Caden, Capsifi, IHS Markit, and the Frontdoor Collective to help solve urgent business problems from optimizing retail shelf space to delivering a better patient care, improving strategic decision making to reducing insurance fraud.
They were originally referred to by their industry domain such as “fintech,” “healthtech” or “insurtech,” but have grown in the thousands — in a wide variety — that focus on data management and advanced analytics around a specific domain such as an industry like healthcare, insurance or retail, a function(s) such as supply chain, R&D or marketing, and/or a competency across industries such as strategic decision making or customer churn. They built their own data analytics platform, often comprised of data lake (or warehouse/lakehouse), a wide and deep assortment of data, and BI and data science capabilities. Additionally, a growing number are employing knowledge graphs or a semantic layer to their architecture to improve their advanced analytics capabilities.
Advanced analytics as a core competency
These startups are delivering value by helping organizations answer increasingly complex questions, fast and with high fidelity, such as:
- How can we improve patient outcomes and reduce costs?
- How can we simulate the price and promotion of X? Defend shelf space?
- How can we reinvent the way insurance is delivered?
- Who are the high-value customers most likely to churn? And what action should we take?
- Who is most likely to defraud Y? Buy X?
- How can we optimize our supply chain efficiency?
- How can we improve “wallet share” for households?
- How can we optimize network performance?
- How can we improve product development efficacy? R&D outcomes?
And with the global datasphere growing to 175 Zettabytes by 2025, the list of questions is boundless. But what do these above have in common? They can be answered with greater speed, fidelity, and lower cost with a burgeoning competency that startups are betting on, called advanced analytics.
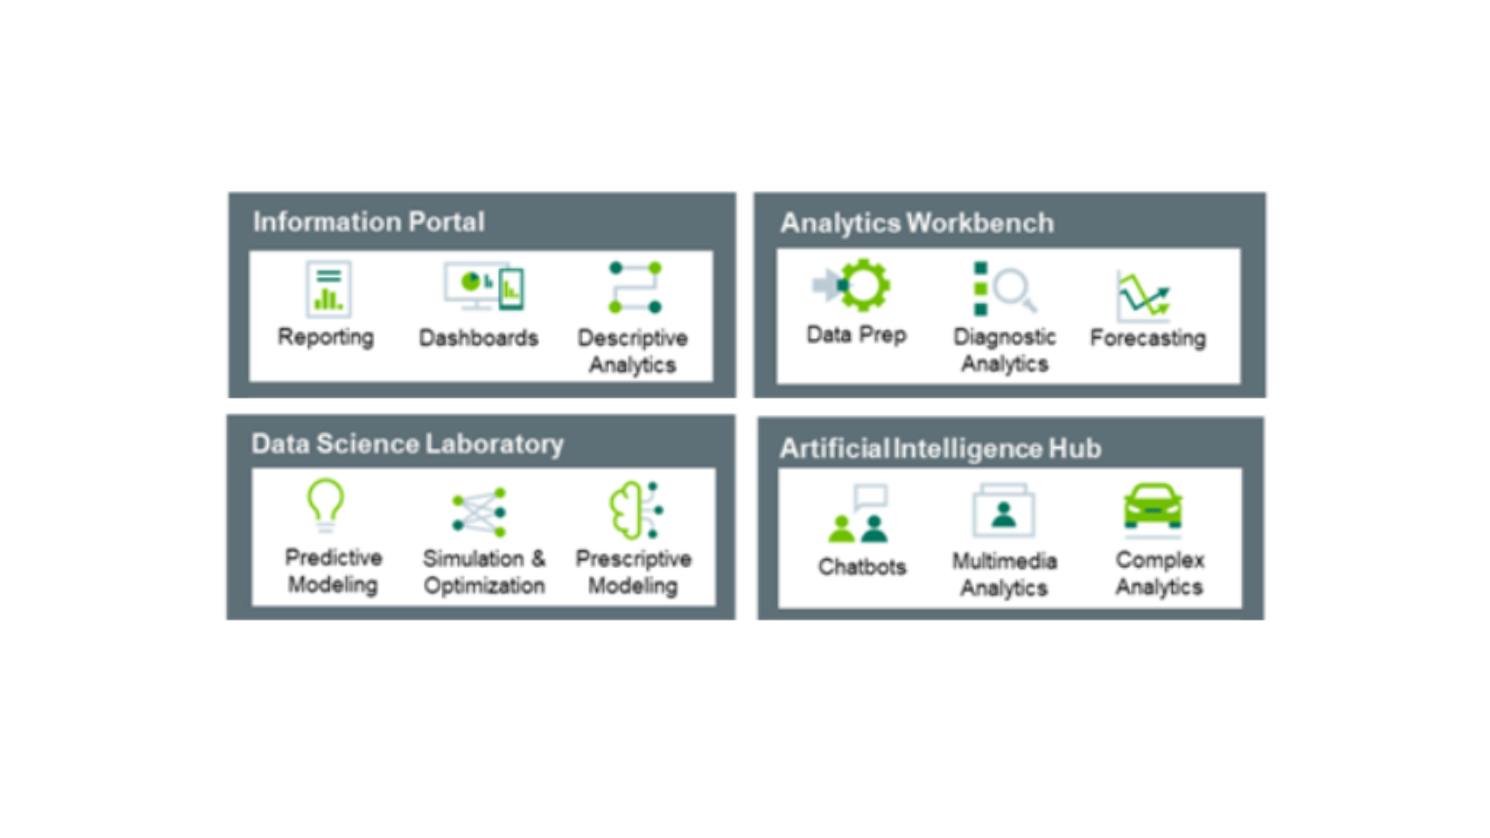
While descriptive analytics answer historical questions such as “what happened?” and are used for reporting, data scientists (and data engineers) apply advanced analytics to answer questions like “what will happen? What action(s) should we take?” As illustrated above, advanced analytics come in different flavors, from diagnostics and forecasting to predictive and prescriptive modeling. AI is another form of advanced analytics used in real-time applications such as recommendations.
Knowledge Graph connects and relates everything, at scale
Advanced analytics have the following in common:
- Access to large amounts of data across formats, domains, and sources — the more, the better
- Ability to incorporate new data sources/sets
- A deep understanding of the relationships between objects — people, places, and behaviors to support wider types of data analysis
- Ability to explore and infer new connections or patterns and relationships between data and uncover (often hidden or counterintuitive) patterns
Advanced analytics is where relational database technology struggles — they have difficulty expressing and revealing how real and virtual entities are related. Columns and rows aren’t how data exists in the real world. Rather, data exists as rich objects and the relationships between those different objects. Even traditional graph databases (aka “Property Graphs”) have serious limitations for advanced analytics. They were designed for storage, resulting in prohibitively high infrastructure costs and creating another silo of centralized data. In contrast, a knowledge graph enriches and amplifies graph as a data structure and graph as a data model into something greater than the sum of its parts.
To make innovative use cases possible at scale, startups such as Capsifi are turning in droves to knowledge graph technology. Enterprise Knowledge Graphs provide the ideal platform to add a semantic layer atop their existing data analytics platform to develop and monetize advanced analytic solutions. Here is a basic explanation (I’ve included additional resources for those who wish to learn more) of what distinguishes a knowledge graph used for scaling advanced analytics:
- Graph-based virtualization to access large amounts of data across formats, domains, and sources and ability to incorporate new data sources/sets as needed – without the need to copy or move the data, which saves on infrastructure costs and analytics development time.
- Rich semantic layer that sits between the analytics consumption and data platform layer and represents explicit and inferred relationships from data. including context of data and metadata and any data interrelationship.
- Data model development and reuse to create a semantic data model with business concepts, reuse and expand the data models to address new use cases, and write federated queries without requiring proprietary language.
- Intuitive search and discovery of data insights to search semantically with context and graphically visualize data relationships to uncover hidden patterns or unexpected insights in relationships, and extend this workflow into popular BI tools such as Tableau and PowerBI.
- Designed for performing large graph-based work at scale, including processing massive semantic or RDF triples without storing data centrally and query performance, thereby improving data & analytics work productivity and time to market.
Further reading: How Knowledge Graphs work
The proof is in the pudding

To this point, I’ve broached business outcomes using timeworn phrases such as faster analytics development time, lower cost, and higher analytics fidelity. Data and analytics executives need real proof of the value of knowledge graphs, but don’t take my word for it. Stardog commissioned Forrester Consulting to conduct a Total Economic Impact™ (TEI) study and examine the potential return on investment (ROI) organization may realize by deploying the Stardog Enterprise Knowledge Graph Platform.
To better understand the benefits, costs, and risks associated with this investment, Forrester interviewed four decision-makers with experience implementing Stardog. For this study, Forrester aggregated the interviewees’ experiences and combined the results into a single composite organization. The key findings were that organizations using the Stardog Enterprise Knowledge Graph platform can realize up to:
- 320 percent return on investment
- $4.9 million in improved productivity of data scientists and engineers from faster analytics development
- $2.6 million in infrastructure savings from avoided copying and moving data
- $2.4 million in increased profits from enhanced quantity, quality, and speed of insights
Outside of the above report, here are a few startup highlights results worth sharing:
RetailTech startup
Challenge
Invested in a data warehouse using RDBMS technology to support 200+ analysts to perform advanced analytics over 30+ applications, costing significant application development time and cost.
Solution
Stardog semantic layer atop their new platform as part of its retail analytics engine that processes retail dictionary data, 3rd party reference sets, and transactional data.
Results
Faster analytics development, improved data & analytics productivity, reduced infrastructure costs
HealthTech startup
Challenge
Invested in a graph database to unify discovery of insights for its analytics team to discover provider/patient relationships and predict fraud waste and abuse, but there were too many manual steps, adding cost and slowing growth.
Solution
Replatform with Stardog Enterprise Knowledge Graph, enabling them to streamline provider/patient insights and develop advanced analytic models.
Results
Faster analytics development, improved data & analytics productivity, reduced infrastructure costs
Further reading: Forrester Consulting Total Economic Impact™ Study Commissioned By Stardog December 2021.
Conclusion
The phrase “every company is a tech company” is giving way to “every company is a data company,” which I believe means the value of technology is shifting from applications to data. And as the size and complexity of data multiply, organizations are increasingly turning to semantic knowledge graphs to harness data and unleash insights that fuel data-informed decisions. According to Gartner Distinguished VP analyst and Gartner Fellow in the Data and Analytics team, Rita Sallam, Gartner predicts that by 2025, graph technologies will be used in 80% of data and analytics innovations, up from just 10 percent in 2021.
X-tech startups in all flavors are quickly adding knowledge graph or a semantic layer atop their data, analytics, and domain competency to harness data and scale advanced analytics to help organizations quickly answer their most pressing business questions such as “who are the high-value customers most likely to churn? And what action(s) should we take?” From financial services to manufacturing, life sciences to retail, these tech startups are bringing bold new solutions that solve 20+ year-old problems to exploit data. And knowledge graphs are becoming the must-have technology to work alongside data lakes (or warehouses or lakehouses) and modern BI tools to ignite data as the “new oil.”
