See how you can use Stardog’s Enterprise Knowledge Graph platform to detect fraud in financial services.
Breaking down data silos is the first step to unlocking the value in your enterprise data. Once the data is centrally accessible, how do we use it to achieve the mission of your organization?
In this blog we explore how an Enterprise Knowledge Graph can be used to detect fraud. For this example we’ll walk through how an analyst can explore several dimensions of data, including People, Companies, Addresses, Shareholding and Bank Transactions.
You can follow along at home: all the data for this post is available for download from
our stardog-examples github repo.
Running the included create_db.sh script will create a Stardog DB and populate it with
11 csv files, one for each data source.
If you haven’t already, install Stardog Studio. It’s a great environment for analysts that are developing queries. You can refine your queries, review results and save your favorites.
Exploring the Data
The following visualization was created using Linkurious. It’s an excellent tool for exploring graphs in an ad hoc manner. This diagram was generated by starting with a query for 50 random relationships followed by repeatedly expanding the leaf nodes and selectively pruning.
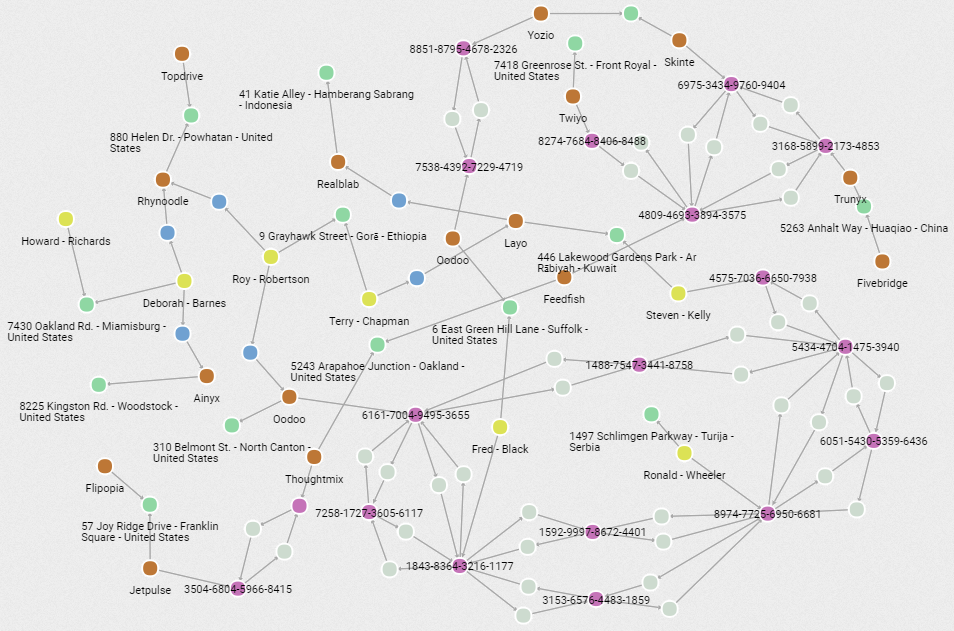
We can also take a top-down approach to exploring the data when it’s unknown to us or lacks an explicit schema. That’s often the case when unifying data over many silos. Let’s start by querying for the number and type of nodes and relationships:
select ?nodeType (count(*) as ?count) {
    ?node a ?nodeType
}
group by ?nodeType
| nodeType | count |
|---|---|
| :Address | 2000 |
| :BankAccount | 1999 |
| :Company | 1000 |
| :Person | 1000 |
| :Transaction | 23259 |
We can see there are 23,259 transactions. We can further explore the nature of these transactions. The following query shows that 22,742 of those transactions are between unique entity pairs.
select (count(*) as ?count) {
    select distinct ?bankAccount1 ?bankAccount2 {
        ?bankAccount1 :originated ?tx .
        ?tx :beneficiary ?bankAccount2 .
    }
}
We can break down that count by the types of the entities involved:
select ?nodeType1 ?nodeType2 (count(*) as ?count) {
    ?entity1 a ?nodeType1 ;
        :hasBankAccount ?bankAccount1.
    ?bankAccount1 :originated ?tx .
    ?tx :beneficiary ?bankAccount2 .
    ?entity2 a ?nodeType2 ;
        :hasBankAccount ?bankAccount2.
}
group by ?nodeType1 ?nodeType2
| nodeType1 | nodeType2 | count |
|---|---|---|
| :Person | :Person | 11966 |
| :Company | :Company | 7801 |
| :Person | :Company | 1745 |
| :Company | :Person | 1747 |
Further we can see the count and total value of transactions between pairs of people:
select ?person1 ?person2 (sum(?amount) as ?total)
                         (count(*) as ?count) {
    ?person1 a :Person ;
        :hasBankAccount ?bankAccount1.
    ?bankAccount1 :originated ?tx .
    ?tx :beneficiary ?bankAccount2 ;
        :amount ?amount .
    ?person2 a :Person ;
        :hasBankAccount ?bankAccount2.
}
group by ?person1 ?person2
order by desc(?total)
limit 5
| person1 | person2 | total | count |
|---|---|---|---|
| :Person-769 | :Person-102 | 981866 | 1 |
| :Person-239 | :Person-337 | 962541 | 1 |
| :Person-641 | :Person-128 | 942512 | 1 |
| :Person-715 | :Person-618 | 940348 | 1 |
| :Person-305 | :Person-132 | 938583 | 1 |
This query returned the 5 pairs of actors with the highest total transaction value. While interesting, merely transferring large sums of money isn’t necessarily a sign of fraud.
Finding Extended Relationships
One feature of graph databases is the ability to “follow the money” across multiple intermediaries. For example, this next query shows all the money that passed between two people via a pair of companies that they each hold:
select ?person1 ?person2 (sum(?amount) as ?total)
                         (count(*) as ?count) {
    ?person1 a :Person ;
        :holds/:company ?company1 .
    ?company1 :hasBankAccount ?bankAccount1.
    ?bankAccount1 :originated ?tx .
    ?tx :beneficiary ?bankAccount2 ;
        :amount ?amount .
    ?company2 :hasBankAccount ?bankAccount2 .
    ?person2 a :Person ;
        :holds/:company ?company2 .
}
group by ?person1 ?person2
order by desc(?total)
limit 5
| person1 | person2 | total | count |
|---|---|---|---|
| :Person-374 | :Person-214 | 369464 | 1 |
| :Person-979 | :Person-870 | 86318 | 1 |
| :Person-466 | :Person-527 | 4215 | 1 |
| :Person-772 | :Person-527 | 4215 | 1 |
| :Person-599 | :Person-259 | 3008 | 1 |
The new element in the last query is the
property path between ?person1
and ?company1 and between ?person2 and ?company2. The / means “followed by.” It
matches when a :Person has a :holds relationship with some object that in turn has
a :company relationship with a :Company. In this case the query matches paths with
exactly one pair of those relationships; however, with the + operator, the expression
can be extended to match one or more :holds/:company relationship pairs:
select ?person1 ?person2 (sum(?amount) as ?total)
                         (count(*) as ?count) {
    ?person1 a :Person ;
        (:holds/:company)+ ?company1 .
    ?company1 :hasBankAccount ?bankAccount1.
    ?bankAccount1 :originated ?tx .
    ?tx :beneficiary ?bankAccount2 ;
        :amount ?amount .
    ?company2 :hasBankAccount ?bankAccount2 .
    ?person2 a :Person ;
        (:holds/:company)+ ?company2 .
}
group by ?person1 ?person2
order by desc(?total)
limit 5
| person1 | person2 | total | count |
|---|---|---|---|
| :Person-374 | :Person-214 | 369464 | 1 |
| :Person-979 | :Person-842 | 146023 | 1 |
| :Person-214 | :Person-194 | 89889 | 1 |
| :Person-99 | :Person-772 | 88665 | 1 |
| :Person-979 | :Person-870 | 86318 | 1 |
This ability to follow an arbitrary number of hops is a key differentiator of graph databases. What we’ve done is identified a meaningful relationship between data elements based upon the structure of the relationships between data items. Yet not all graph databases are created equally. Stardog is a Knowledge Graph platform, that is, a graph database tightly coupled with a Knowledge Toolkit. If the graph database enables finding meaning in structure, the knowledge toolkit adds to it various kinds of inference. Let’s extend our example to explore inference in more detail.
Inferring New Relationship Types
In the last example we looked at combining shareholder and transaction data to sniff out fraud, but we have other useful data that could help. The hypothesis that we will explore is that fraudsters will take steps to spread their illicit activities around, passing money from account to account, across financial institutions based in multiple countries, through shell companies and other affiliated entities. We aim to identify these webs of activity and score them in a way that helps us decide where to direct our resources.
In our data set, in addition to transaction data, we also have address information as well as records for shares of held companies. We could modify our query to factor in all these types of activity, but it can be much more powerful to define what it means to be “affiliated” in a central location and then use that “affiliated” relationship in our queries. Let’s “extend” the query language with some business logic, which promotes separation of duties and good reuse among disparate teams.
We’ll create a :hasAffiliation relationship that encompasses any entity that shares an
address with another entity or any pair of entities where one entity holds a substantial
share of the other’s stock.
To define the :hasAffiliation relationship, we’ll add a couple of rules to the Knowledge Graph.
To add the rules, you simply insert a triple with a reserved
stardog:rule:content predicate. Stardog will detect the rule and apply it to any relevant query
that has reasoning enabled. Here are the two triples that define our rules:
IF {
    ?x :hasAddress ?a .
    ?y :hasAddress ?a .
    filter (?x != ?y)
}
THEN {
    ?x :hasAffiliation ?y .
}

IF {
    ?x :holds ?holding .
    ?holding :company ?c .
    ?holding :share ?share .
    filter (?share >= 50)
}
THEN {
    ?x :hasAffiliation ?c .
    ?c :hasAffiliation ?x .
}
The first rule says two entities are affiliated if they share an address. The second says they are affiliated if one holds a 50% or greater share of the other. The relationship is symmetric (if x is affiliated with y, then y is affiliated with x) in both cases. The first is so because it is not possible for one to share an address with another without the second sharing the address with the first. In contrast, it is possible for one to hold shares in another without the relationship being reciprocated. However, we explicitly define both relationships in the second rule so it always holds in both directions because we are more interested in how the money flows than which company owns which.
Rewriting the last query in terms of affiliations, we can capture the aggregation of all the transactions between all the affiliates of any two people. The purpose of ordering the results by the total value of the transactions between actors is to rank the network by potential risk, but we can do better. The key indicator for fraud under our hypothesis is not so much the total amount of money transacted, but rather the number of distinct paths the money flows through.
We want the total dollar amount to be a factor, but we want the network size to matter more. To achieve this, we’ll add an extra term to our score: the square of the path count between the pairs of actors.
(Why the square of count? The motivation is to give count more weight than total. Your mileage may vary. No formula will sort all fraudulent activity ahead of legitimate activity. Feel free to try any decimal exponent as an alternative to 2.)
# Fraud score as Money * (Paths Count)^2
select ?org ?name1 ?ben ?name2 ?score {
    {
        # Count distinct paths
        select ?org ?name1 ?ben ?name2 ?s (count(*) as ?c) {
            {
                # Group by intermediaries
                select ?org ?name1 ?ben ?name2 ?t1 ?t2 ?s {
                    ?org :lastName ?lname1 ;
                        :firstName ?fname1 ;
                        :hasAffiliation* ?t1 .
                    ?t1 :hasBankAccount ?a1 .
                    ?a1 :originated ?tx .
                    ?tx :beneficiary ?a2 .
                    ?t2 :hasBankAccount ?a2 ;
                        :hasAffiliation* ?ben .
                    ?ben :lastName ?lname2 ;
                        :firstName ?fname2 .
                    {
                        # Find highest sum of Tx for all paths
                        # between ?org and ?ben
                        select ?org ?ben (sum(?m) as ?s) {
                            ?org a :Person ;
                                :hasAffiliation* ?t1 .
                            ?t1 :hasBankAccount ?a1 .
                            ?a1 :originated ?tx .
                            ?tx :beneficiary ?a2 ;
                                :amount ?m .
                            ?t2 :hasBankAccount ?a2 ;
                                :hasAffiliation* ?ben .
                            ?ben a :Person .
                        }
                        group by ?org ?ben
                        order by desc(?s) ?org ?ben
                        limit 1000
                    }
                    bind(concat(?fname1, ' - ', ?lname1) as ?name1)
                    bind(concat(?fname2, ' - ', ?lname2) as ?name2)
                }
                group by ?org ?name1 ?ben ?name2 ?t1 ?t2 ?s
            }
        }
        group by ?org ?ben ?name1 ?name2 ?s
        order by desc(?s) ?org ?ben
    }
    # Calculate score as total money transacted times
    # the square of unique path count between actors
    bind(?s * ?c * ?c as ?score)
}
order by desc(?score) ?org ?ben
| org | name1 | ben | name2 | score |
|---|---|---|---|---|
| :Person-214 | Douglas - Gomez | :Person-123 | Howard - Richards | 22985575 |
| :Person-214 | Douglas - Gomez | :Person-466 | Deborah - Barnes | 22985575 |
| :Person-214 | Douglas - Gomez | :Person-505 | Steven - Kelly | 22985575 |
| :Person-214 | Douglas - Gomez | :Person-772 | Roy - Robertson | 22985575 |
| :Person-214 | Douglas - Gomez | :Person-842 | Terry - Chapman | 22985575 |
| :Person-754 | Laura - Dean | :Person-123 | Howard - Richards | 22985575 |
| :Person-754 | Laura - Dean | :Person-466 | Deborah - Barnes | 22985575 |
| :Person-754 | Laura - Dean | :Person-505 | Steven - Kelly | 22985575 |
| :Person-754 | Laura - Dean | :Person-772 | Roy - Robertson | 22985575 |
| :Person-754 | Laura - Dean | :Person-842 | Terry - Chapman | 22985575 |
| :Person-99 | Shawn - Gordon | :Person-123 | Howard - Richards | 22985575 |
| :Person-99 | Shawn - Gordon | :Person-466 | Deborah - Barnes | 22985575 |
| :Person-99 | Shawn - Gordon | :Person-505 | Steven - Kelly | 22985575 |
| :Person-99 | Shawn - Gordon | :Person-772 | Roy - Robertson | 22985575 |
| :Person-99 | Shawn - Gordon | :Person-842 | Terry - Chapman | 22985575 |
| :Person-425 | Jason - Gilbert | :Person-4 | Bobby - Parker | 2802544 |
| :Person-425 | Jason - Gilbert | :Person-540 | Philip - Kim | 2802544 |
| :Person-751 | Andrew - Schmidt | :Person-4 | Bobby - Parker | 2802544 |
| :Person-751 | Andrew - Schmidt | :Person-540 | Philip - Kim | 2802544 |
| :Person-160 | Jacqueline - Grant | :Person-11 | Kathy - Woods | 2347852 |
| :Person-160 | Jacqueline - Grant | :Person-497 | Jack - Anderson | 2347852 |
| :Person-473 | Willie - Carr | :Person-169 | Larry - Burton | 1335232 |
| :Person-473 | Willie - Carr | :Person-503 | Larry - Jordan | 1335232 |
| :Person-473 | Willie - Carr | :Person-53 | Edward - Wallace | 1335232 |
| :Person-256 | Kenneth - Garcia | :Person-4 | Bobby - Parker | 1229192 |
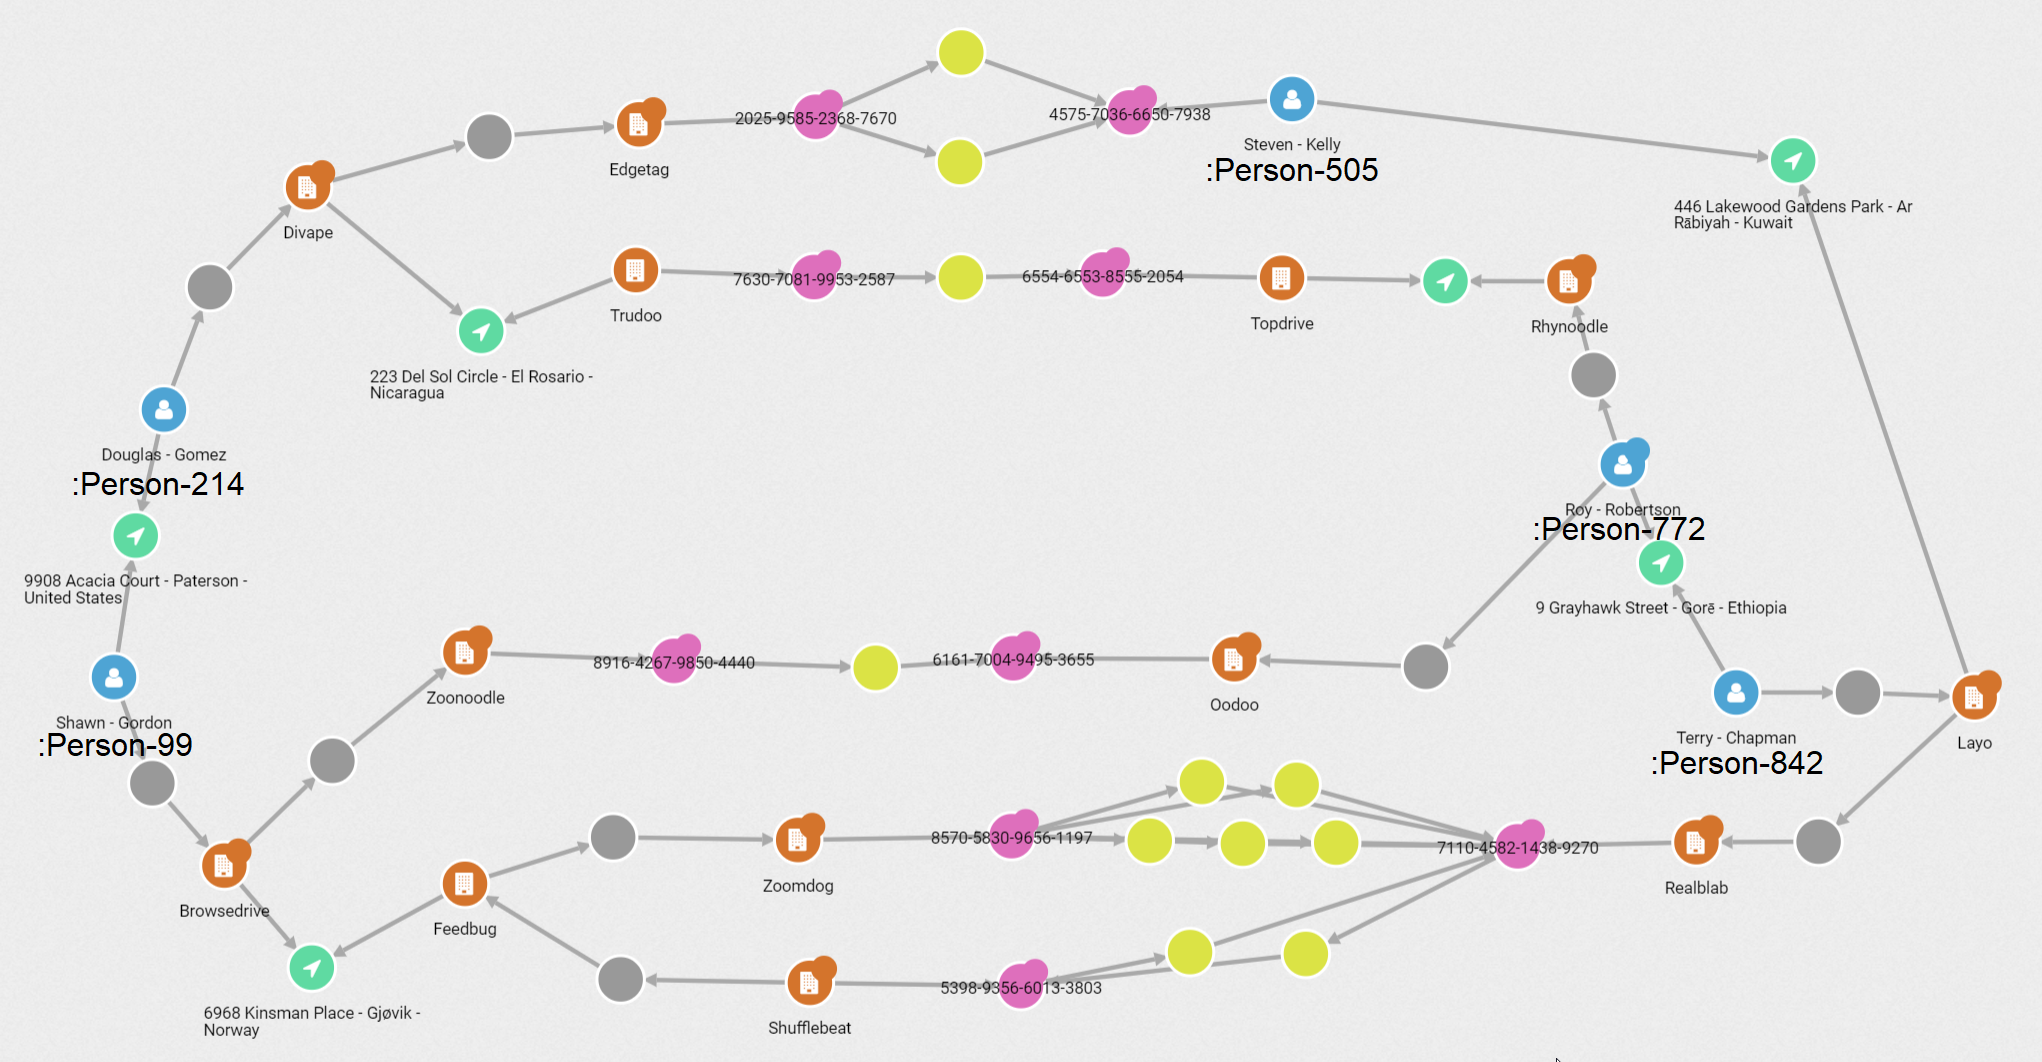
When we add this factor to the score, the number one ring is a network with 5 distinct paths involving 9 actors: 4 on the originator side and 5 beneficiaries. This ring is followed by smaller rings of size 4 (:Person-425,:Person-751 -> :Person-4,:Person-540), 3 (:Person-160 -> :Person-11,:Person-497) and 4 (:Person-473 -> :Person-169,:Person-503, :Person-53). (All actors in a ring will share the same fraud score.)
We can drill down by modifying the query to list all the transactions between a specific pair of actors to get a sense of the activity.
select * {
    :Person-99 :hasAffiliation* ?t1 .
    ?t1 :hasBankAccount ?a1 .
    ?a1 :originated ?tx .
    ?tx :beneficiary ?a2 ;
        :amount ?m .
    ?t2 :hasBankAccount ?a2 ;
        :hasAffiliation* :Person-842 .
}
order by ?a1 ?a2
| t1 | tx | t2 | m |
|---|---|---|---|
| :Company-109 | :Tx-11061 | :Company-455 | 88665 |
| :Company-289 | :Tx-5463 | :Person-505 | 91252 |
| :Company-289 | :Tx-18762 | :Person-505 | 95239 |
| :Company-399 | :Tx-3698 | :Company-868 | 98234 |
| :Company-656 | :Tx-13928 | :Company-316 | 95499 |
| :Company-664 | :Tx-16418 | :Company-316 | 92418 |
| :Company-664 | :Tx-15065 | :Company-316 | 93489 |
| :Company-664 | :Tx-456 | :Company-316 | 96067 |
| :Company-664 | :Tx-14358 | :Company-316 | 89810 |
| :Company-664 | :Tx-14563 | :Company-316 | 78750 |
In this case there are 10 transactions with values between $78,750 and $98,234 spread over 5 unique paths. If this is a true fraud ring, we suspect all 9 actors as being active participants in the scheme.
Visualizing the Networks
With a tool like Linkurious we can visualize this network. It’s
not perfectly obvious, but if you judge by distance from the actual transactions, one
might suspect :Person-99 and :Person-842 as being the ultimate originator and
beneficiaries.
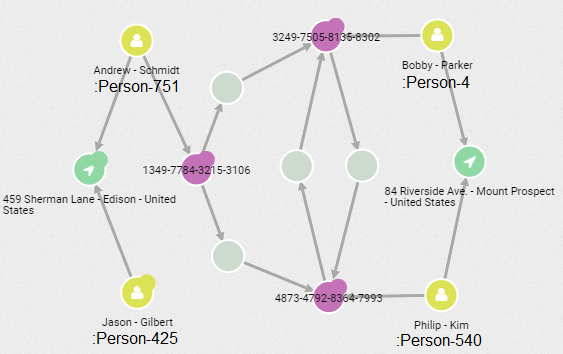
Contrast this network with the visualizations of the three other networks that were returned in the top 25 of our search.
This is the ring with originators :Person-425 and :Person-751 and beneficiaries
:Person-4 and :Person-540:
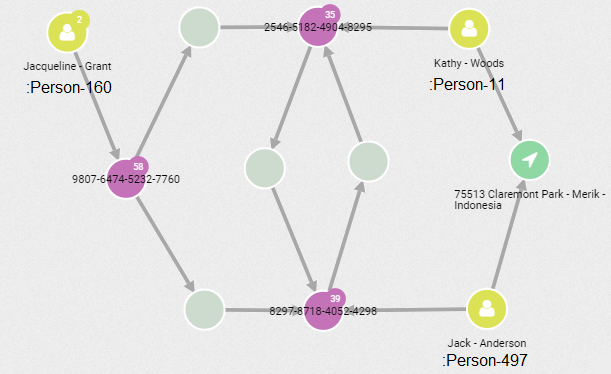
Here is originator :Person-160 and beneficiaries :Person-11 and :Person-497:
And finally originator :Person-473 and beneficiaries :Person-169, :Person-503 and
:Person-53:
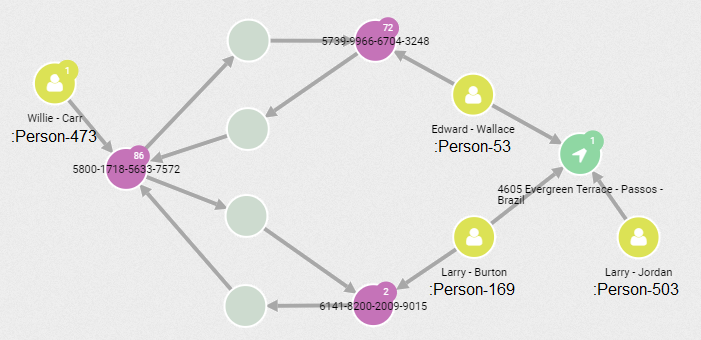
At a glance one can see that one of these pictures is not like the others. While each network is unique, with experience the eye can quickly recognize visual patterns. Pairing the initial query with the visualization can be a powerful combination.
A Powerful Combination
This example illustrates the power that comes from the Knowledge Graph in Stardog. I encourage you to download the example and experiment with your own queries. Or, extend your fraud detection solution using Virtual Graphs and statistical inference using Stardog’s machine learning. Read more in part two in our series on finding fraud using Stardog.
