Graph Databases vs. Relational Databases: Know the Differences

Get the latest in your inbox

Get the latest in your inbox
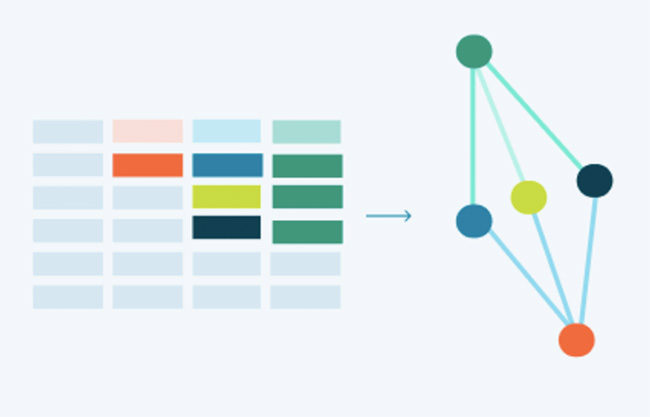
Graph refers to a data organization system that emphasizes the relationships between data points. This approach contrasts with the more traditional relational data systems — where data is stored in tables.

Most people are familiar with relational databases. Commercially popular since the early 1980s, examples include Oracle or MySQL. Tables include table names and there are a fixed number of attributes with fixed data types in each column. Each table row is a record.
But graph databases have been around for a long time, too, with commercial options becoming available in the 2000s.
We have other in-depth pages that discuss what a graph database is and graph database examples. So we’ll keep this explanation brief.
Graph databases emphasize the relationships between data points.
From a technology standpoint, we can describe graph thusly: Graph databases contain nodes, edges, and properties.
Using a query and a starting point, graph databases search all their interconnected points and gather information from all the nodes and relationships — up over a trillion triples these days. (What’s a triple? It’s a node-edge-node set.)
Edges (and the relationships they represent) make graph databases unique. Meaningful and unobserved patterns can be found when reviewing the edges connecting the nodes. By focusing on the relationships, the graph data model is fundamentally simple, expressive, powerful, easy to modify, and endlessly extensible.
Some liken the graph way of doing things to the way human brains think and map associations—neurons are the nodes and synapses the relationships. This makes them very intuitive to users, once those users get past the relational database model.
Relational databases represent data in tables. Each row in the table is a record with a unique ID (the key). The columns of the table hold attributes of the data.
Although the name ‘relational database’ implies a focus on relationships, tables can only reflect that the column data in a row is related, but the nature of the relationship may never be recorded, leaving users to guess what the data represents based on sometimes obscure table or column names. The flexibility to examine, add, and change the relationship isn’t there.
What’s more, relational databases can traverse relationships, but traversing relationships from relational databases tend to require accessing more of the underlying data (you need more compute power) and longer, harder to follow queries (which takes a higher degree of specialization in the database/dataset/query).
Relational data models are created with initial assumptions about data relationships. And then you are stuck with them. These models are limiting because they capture a mere fraction of all the possible relevant relationships between data elements.
Graph databases operate in stark contrast to relational data. Finding connections between different relational databases requires time-intensive data modeling and query operations. Each new question produces a new dataset with its own schema. That’s not sustainable for the rate of new and unanticipated questions that the business wants to ask of its data. Today, data and analytics leaders need to be able to quickly support iterative question and answer cycles from the business and easily dig into new territory in their data.
Instead of rows and columns and tables and keys, graph organizes information using nodes and edges to represent entities and the relationships between those entities.
Relational ruled for a time. Then NoSQL databases came about, but many kinds failed to address the importance of relationships. The data model for the next 20+ years will be graph.
Graph databases are designed to hold data without restricting it to a fixed, predetermined model. This makes graph databases very good at managing complex queries and at dealing with dynamic data.
Relational systems are designed for completely stable and static business processes where the data model remains unchanged.
While there are many graph database use cases you’ll see it is common to adopt graph technology for modern analytics, semantic search, recommendation engines, digital twins, data fabrics, and the like.
Here are some technical scenarios in which you probably want to strongly consider graph:
Inter-connected data: If your data needs to be connected in complicated ways, and/or has lots of relationships between data, consider graph. In these situations, we tend to see an intrinsic need for relationship analysis.
The many-to-many table: If you have three hops or more, strongly consider graph rather than the traditional “many-to-many” table. Otherwise, you’ll have a mountain of maintenance to do over the next few years. Make your investment in graph now and save your future self some time.
Join operations: If you use a lot of join operations in your queries. Problems occur when queries get so tangled that even the most powerful databases break down while trying to bring the resulting data together. Use graph instead.
Dynamic data modeling: Static data models are built with intention and for a specific purpose, resulting in a singular user experience that inevitably fails to serve all user groups. Smart, dynamic modeling empowers all kinds of users (from power users to business analysts). The comprehensiveness and flexibility embraced in graph modeling make it an excellent choice for dynamic data modeling.
Semantic modeling: If you want to leverage a common format that everyone can agree on and all systems can understand, consider a knowledge graph. A semantic layer (often laid over a data lake, data warehouse, or lakehouse) excels at enabling data connection, exchange, reuse, and business understanding.
Stardog simplifies the story by supporting all forms of graph modeling types. We allow users to focus on what capabilities best match their use case. Stardog enables both full semantic knowledge graphs, but also can build any form of graph, including adding property graphs with our edge properties.
We’re huge fans of the semantic + graph approach here at Stardog, so permit us to go a little deeper.
Semantic layers:
By taking the semantic approach, you open up many seemingly unrelated use cases, spanning identity and access management, fraud detection, social networks, operational risk management, advanced analytics, knowledge management, etc. You can start small in scope while connecting to massively comprehensive and complicated data sets.
The Stardog platform has many excellent features that elevate the typical graph approach. You can choose to virtualize or materialize data from a myriad of connections that include many data types. Our Inference Engine lets you harmonize conflicting data definitions without changing or copying the underlying data. You can traverse paths with Pathfinder. There are built-in machine learning and data quality management tools. It’s all based on open standards and built atop a high-performance graph database. And these tools are available via both low-code (Designer and Explorer) and SPARQL-based (Studio) options.
We mentioned before that relational databases are best used for ultra-stable business processes where the data model remains unchanged. Consider relational databases:
Your organization likely uses relational databases already, and has for years. But consider adding graph. Graph is designed to scale and offers flexibility that’s tough to find in other kinds of databases. Its emphasis on relationships enables exciting new ways of thinking about data and the ability to make good business sense of organizations’ ever-increasing amounts of complex data.
How to Overcome a Major Enterprise Liability and Unleash Massive Potential
Download for free