Practical steps for building knowledge graphs: powerful tools for linked data, data integration, and data management. Scale all those use cases that have been inspired by data science. Increase your number of users, as needed. And spread the use of data itself.
Do you really need a knowledge graph?
Data rules the world. But organizations struggle to leverage that data for a competitive advantage. Raw, uninterpreted data in a system somewhere isn’t very helpful. To be helpful it must be related to the business context of the enterprise that owns it. In other words, what matters more than data is business meaning. The primary goal of knowledge workers is to derive actionable knowledge from mere data to make better decisions—the true hallmark of a connected enterprise.
So, what choices do you have? A data catalog? ETL? Other forms of data movement? A graph database? They all fall short of creating a well-connected enterprise. Data catalogs are expensive to purchase and lack the context needed to create knowledge. There are low adoption rates when it comes to populating them with accurate metadata. Or, the catalog is overly broad and superficial. ETL processes rely heavily on other systems and manpower to run queries. They work best with consistency, and real-world data is anything but. Relational databases and even graph databases, which were built for storage, can’t achieve connection and context alone. Data management systems haven’t kept pace.
Stardog goes to where the data is. As an Enterprise Knowledge Graph platform, it connects and enables all your data and data systems—governance, storage, visualizations, and security. An Enterprise Knowledge Graph is a linchpin to how businesses can maintain (or begin) a data-centric strategy while operating in a more complex infrastructure.
You may be an evangelist for “change within your organization,” or perhaps management asked you to investigate this “new trend.” Or maybe you’re already sold on the knowledge graph approach and you want to follow the best methodology possible. You could be a data scientist, a machine-learning specialist, a data engineer, or anyone else who works with data or knowledge bases. Whatever your scenario, and whoever you are, start here.
Determine the use cases for your knowledge graph
The possible use cases for your knowledge graph are practically limitless. You can start small with a single project dedicated to product and engineering lifecycle management for example.
Or go large with a digital twin strategy, creating a machine-understandable model of the business. You might be focused on artificial intelligence projects, possibly building recommendation engines or chatbots that use natural language processing (NLP). To get you thinking, here are some use cases that really showcase the strengths of a knowledge graph.
Analytics modernization: Modernize your data platform with the knowledge graph built to empower data and analytics teams to connect any type of data, uncover impactful insights, and speed time to market.
Data fabric: Create a flexible, reusable data layer for answering complex queries across data silos. An Enterprise Knowledge Graph platform like ours accomplishes this through a unique combination of graph data, virtualization, and inference.
Data lake acceleration: An Enterprise Knowledge Graph makes it easy to connect data lakes and semantically enrich and query datasets for analytics so teams can make faster, more informed decisions.
Drug discovery: An Enterprise Knowledge Graph provides the highly flexible data layer organizations need to make data findable, accessible, interoperable, and reusable (FAIR) and repeatably identify promising drug targets.
Operational risk: Unify existing IT asset management data to create a holistic view of all connected inventory. Marry this information with incident reporting, control registries, and other risk management apps to create a reusable semantic layer to manage operational risk.
Semantic search: Search based on the meaning of the query and get more intuitive results. Get the right answers, faster, no matter the structure or location of the underlying data. For products with built-in search engines, providing the right information to customers increases user satisfaction and engagement.
Supply chain: Create a digital representation of the data and the relationships that define how work truly is done within your organization. Instantly see the connections in their supply chain to enable scenario planning based on complete data, rapid identification of needed operational changes, and organizational resiliency to drive long-term customer value and higher profit margins.
Outline the necessary data needed
Once you’ve decided on your use case for your Enterprise Knowledge Graph, there are a few things to keep in mind throughout the build. 1) All knowledge graphs start off with data, 2) Building them will be iterative, and 3) Always build it through the lens of your use case. Avoid business modeling for modeling’s sake.
To get started, break the project scope into chunks. Ask yourself, “What are the first two or three initiatives to start with? What questions am I trying to answer?” Work with subject matter experts to both help define the business questions.
Then take a closer look at all the information available from a field of knowledge. Identify all the categories, types, things, and objects that are important to the field. If you have similar information from your organization’s data governance programs or industry data catalogs, include that. If things start to get unwieldy, focus it down.
You are aiming to understand how all these categories, types, things, and objects relate to each other and what information is out there to describe them even more accurately. This is the “conceptual model.” And in a semantic knowledge graph like Stardog, it’s represented by a schema or ontology. But first things first.
You are also trying to figure out where all this data lives. Subject matter experts can help there too. As you identify them, make sure you request access to any pertinent data sources.
Organize the data
Once you have your business questions set and your data identified, it’s time to start organizing that data.
A good rule of thumb is to spend no more than 2 weeks on this and look at no more than 5-10 different entities. If you look at your questions, and they require more than 5-10 entities for you to understand and model, it is probably too big of a question, and you should go back to step one and refine your scope.
There are several things you can do to help ensure success at this stage. There are many publicly available data models, like FIBO, Brick, and others that can be found on sites like schema.org that you can leverage. With these reusable data models, you’re not starting with a blank sheet of paper; you’re starting from work that other people have done. If your organization has a data catalog, this is another resource you can leverage. A lot of data catalog initiatives have already defined key business terms and determined how these terms are related to one another.
Stardog helps with data modeling by allowing you to connect to existing data catalogs so you have a starting point to create an initial data model. We’ve also created a visual environment for you to build these data models.
Map relationships with ontologies
Knowledge graphs, as we know, are purpose-built for the fluctuating nature of knowledge. They easily accept new data, new definitions, and new requirements. The “graph” in knowledge graph refers to a way of organizing data that highlights relationships between data points.
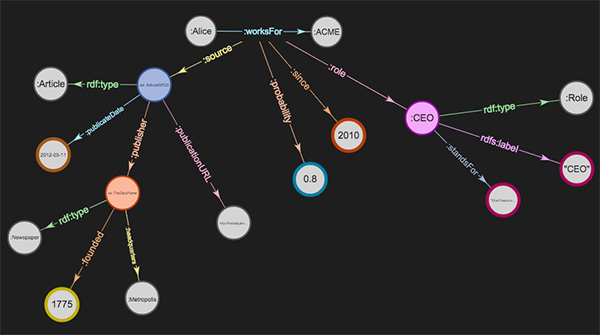
These relationships are key to keeping knowledge graphs nimble. Once you’ve identified and organized your data, in the context of your original use case and business questions, it’s time to focus on the relationships between all this data. Perhaps you’ve heard of triples? In a knowledge graph, entities (for example, objects, people, or places) are represented as nodes, and the relationships between entities (for example, “made by”) as edges. Essentially, two nodes connected by an edge form a triple.

Again, we’re going to insist you don’t try to or expect to create a super ontology that will be the single source of truth. Keep it small to start; just enough to answer your business questions. Over-specification will hinder extensibility. You can determine if your ontology contains enough information by defining the required entities and property relationships.
Here are some best practices: Specify core classes (representing entities), properties, and individuals. Use non-technical words to describe your relationships and reuse terms when possible. And as mentioned above, you may want to reuse existing organizational and public ontologies, if it makes sense. You should always be aware of existing ontology standards.
Ontology management and knowledge graph development are iterative processes and will evolve as time goes on. Bring your stakeholders into your process, frequently. Show them how the ontology relates to the data and how it can help answer questions.
See what we mean: This beginner-level training teaches the basics of successful data modeling for developing an Enterprise Knowledge Graph. Learn about the various types of data models used across the graph domain with a specific focus on ontology models, a particular model type frequently used in knowledge graph development.
Create a knowledge graph from a small data sampling
Now it’s time to build your knowledge graph. Stardog Designer is an application for no-code, visual modeling, and data source mapping. Designer makes implementing a knowledge graph much more intuitive for data modelers, developers, and administrators. So, we’re going to use that for this step.

This is where you tie the metadata, the model, and the data itself to the downstream systems. If you’ll remember, we previously mentioned you needed to pre-negotiate access to the data sources required to answer your business questions. We’ve seen projects get bogged down at this step if they don’t have that access already in place so be sure you take care of that ahead of time.
We’ve built database connectors to make it easier to unify your data. Stardog has connectors for all major SQL systems and the most popular NoSQL databases. In addition, we built the BITES pipeline to process your unstructured data like research papers, resumes, and regulatory documents. A CSV is no problem. We also connect to BI tools, cloud services, and CRMs.
In Designer, you can simply connect to a blank database and create a new project there. Load in some data and just start working with it. You may want to start with some cleaning to make the data easier to map later. But once you create the resource, you can start modeling. And once the model is done, you can export it.
The easiest way to teach you is to show you, so check out Stardog Designer. Advanced users always have the option to use Stardog Studio.
Analyze the deliverable and adjust as needed
Whatever knowledge graph creation tool you use, you’ll need to analyze your build and adjust as needed. You’ll want to assess your knowledge graph for both usefulness and accuracy.
For both those tasks, you’ll need to run queries on your knowledge graph. Stardog, again, provides an easy, no-code solution, called Stardog Explorer, which is an intuitive web browser tool for anyone to browse the connections in their knowledge graph. SPARQL queries can be run using our Stardog Studio application.
When considering usefulness, connect back to your original business questions and use case. What would make the use case a success? Can you easily answer the business questions you originally asked? Could someone else?
When considering accuracy, think about ways you could improve your taxonomy. Revisit your data sources and make sure you are including all the right ones. Verify that your ontology is complete enough to answer any queries, but not so built out that it hinders future additions. It’s good to know how “complete” your model is because chances are strong your organization will build upon this work for additional use cases and to solve new business needs.
Now is the time to dot your I’s and cross your t’s. Make sure you are following design standards, industry standards, and any formal rules for your structure and content. Your labels should use correct spelling and consistent capitalization.
It’s critical that the data be valid and consistent. Stardog offers tools to validate and enforce data integrity. Specify constraints to find inconsistencies across your data silos, flag conflicting data, or prevent the knowledge graph from accessing bad data. Constraints also support measuring the quality of the data, performing verification after an integration, and assisting in planning future improvement measures.
Complete the creation of the Enterprise Knowledge Graph
Now is the time to turn your Knowledge Graph into an Enterprise Knowledge Graph.
At this point, you should have noticed how data virtualization really comes into play. The greatest advantage of virtualizing your data is that it accelerates your time to value. You don’t have to worry about extracting out the data, making sure it’s in a format you can use, reformatting the data, loading it, and waiting for the jobs to finish. Instead, you can look at the data in place and leverage the investments you’ve already made in existing data repositories.
But some systems are not well suited to being virtualized. For example, data sources where performance is the top concern. There also might be security concerns, for example with external systems. You also need to consider how often your data changes and how often it will be accessed. All this is why the combination of virtualization and materialization capability is so important. FYI—Stardog supports completely seamless virtualization and materialization so you can access any data, whether it’s on-prem or in the cloud.
Inferencing is another great component of an Enterprise Knowledge Graph. Use an Inference Engine, like Stardog’s, to discover new relationships within your data. By inferring new connections between concepts in the knowledge graph, the resulting network of information becomes increasingly more valuable.
Inference creates new relationships by interpreting your source data against your data model. By expressing all the implied relationships and connections between your data sources, you create a richer, more accurate view of your data. This includes the ability to represent multiple definitions for the same data, empowering collaboration between stakeholders.
Evaluate whether business needs are met
Let’s take a moment to consider the concept of “explainability.” As you create your Enterprise Knowledge Graph and evaluate whether business needs are met, it’s useful to have highly explainable logic. Stardog offers transparency into how results are derived.
For inferencing, Stardog can present explanations of inferences in a tree-like form so the user can review the logic that led to their answer. It’s simply not a black box algorithm when it comes to inferencing. Constraints to ensure data quality, likewise, are highly explainable in Stardog. Our tools offer explanations for violations of the constraints, telling you not just that there is invalid data, but precisely what that invalid data is, and why it’s invalid so that you can understand the issue and fix it more effectively.
Understanding and exploring the connectedness of the knowledge graph—using the path from one node to another—is key to finding the answer to your questions. For example, what does the supply chain look like for this batch of troublesome parts? This kind of question is directly expressible using Pathfinder. Pathfinder can traverse the graph—across materialized and virtualized sources—and identify different kinds of paths between the nodes. And, of course, it’s available in Stardog’s Enterprise Knowledge Graph platform.
Conclusion
The differentiator of a strong Enterprise Knowledge Graph is that it can grow over time. This means repeating the above process and using the above-mentioned tools as you go on to the next business question. Those questions could reuse some of the same items you’ve already modeled or perhaps they require connecting new data sources or even additional models. You may not start out as a Wikipedia, Google, or Amazon (all use knowledge graphs), but you will be able to start small and grow rapidly.
By iterating through this process repeatedly, you’ll build out a full picture of your organization that can be represented in an Enterprise Knowledge Graph or Data Fabric. All of the work you’ve done previously can be leveraged and built upon so not every project needs to be begun anew.
If you’re ready to learn more about Stardog, visit our “Getting Started” tutorial today!
