What is the most disruptive force in the automotive industry? Electric engines? New business models? Consumer mobility? Nope. The real firebrand for the industry lies in a different kind of engine known as data. Automakers, suppliers, and dealers must adapt quickly to the changing landscape by harnessing the power of data and knowledge graphs to jump-start advanced analytics today.

Big data, or advanced analytics, requires the automobile manufacturing industry to connect data from many sources, including organizational, product, supply chain, dealer, third party, vehicle, and customer systems. And with the emergence of industry IoT, electrification, and machine-to-machine communication, automakers and suppliers confront ever more massive amounts of semi and unstructured data, as well as data silos that make it more difficult to develop the analytics models that answer urgent business questions, such as:
“What happens to production and supply chain if I change the coating of brake fittings from chrome to nickel? What components are most likely to fail or recall? What actions should I take?"
“How can I improve forecasting demand? Optimize inventory space? Predict supplier lead times and production risk? What are the root causes of vendor delivery failures and what actions should I take?"
“What happens to demand if I change pricing? Promotion? How can I provide personalized experiences to my customers? Grow lifetime value?"
Data lake (or warehouse) + knowledge graph = turbocharged big data analytics
Big data analytics technology — from data lakes to analytics platforms to stream processing — is built on rigid data models and a tabular view of how business works, significantly hampering an organization’s ongoing ability to answer these and other questions quickly and with high integrity. Data engineers, analysts, and scientists spend too much time as a data “vacuum” and “janitor,” physically extracting, cleaning, and manually exploring data sets, establishing relationships, and joining them together. They also frequently must refine data from its natural, unstructured state using tribal processes that are time-consuming, not scalable, and, worse, error-prone. It is not surprising that data scientists also consider themselves a “fortune teller” regarding predictive analytics confidence.
To tackle this head-on, McKinsey & Company recommends that organizations implement flexible knowledge graphs onto an existing data and analytics architecture. The Google Knowledge Graph, announced in 2012, significantly enhanced its data products. In the same way, automakers can add this “semantic layer” to easily visualize relationships between different classes of data and data points, dramatically reducing the time (and cost) to analytics insight and improving quality.
Getting started with graph analytics in automotive
A growing number of automakers are deploying knowledge graphs to harness their vast internal (organizational, product, customer, supply chain, event, warranty claims, customer interactions) and third-party data such as social media and weather. Data and analytics teams can quickly connect large sets of structured, semi, and unstructured data and easily model complex and dynamic relationships and meaning. This uncovers and infers powerful patterns and insights that can apply to the following use cases today:
Product quality, recall, and customer satisfaction
- Diagnosing underlying causes of quality problems, allowing for the early detection of issues, and minimizing the probability of recurrence. For example, a transmission system may be performing below the expected level, indicating the need for early repair work (and consequently refuting the need for a costly replacement job).
- Predicting costly product recalls and proactively prescribing actions that mitigate risk and maintain customer satisfaction.
- Prescribing a more satisfying and personalized experience to each user, particularly as cars move towards a smarter and connected environment.
Supply chain risk management and performance
- Simulating supply chains to reveal potential flaws throughout the ecosystem to proactively take measures to optimize (and adapt) to mitigate risk and safeguard performance.
- Predicting supplier management issues to solve problems preemptively and collaboratively, such as delivery interruptions or product quality issues.
- Forecasting demand to reduce inventory and improve supplier relationships.
- Predicting future warranty claims (and fraud) and determining root causes by supplier issues.
Further reading: How to Build a Modern Supply Network with a Data Fabric
Sales & marketing mix and customer targeting
- Understanding customer purchase propensities and brand affinity to deliver more targeted, controlled, and informed sales and marketing initiatives.
- Predicting customer (and household) lifetime value and prescribing personalized programs and offers to maximize customer loyalty.
- Proactively identify new purchase behaviors by considering factors like vehicle information (especially with software and sensors in automobiles) and social media to promote one-to-one offers.
Knowledge graphs vs. graph database
When you consider the surging automotive data landscape and high demand for advanced analytics, it is obvious why a data lake (or warehouse or lakehouse) requires a semantic layer, which represents the business logic of the company, integrates all source data models, and acts as a translation layer between users and the ocean of data through:
- Easy, low-cost access to large amounts of data across formats, domains, and sources
- Ability to adapt to new use cases and data sources/sets.
- A deep, dynamic understanding of the relationships between objects – people, places, behaviors to support wider types of data analysis.
- The ability to explore and infer new connections or patterns and relationships between data and uncover (often hidden or counterintuitive) patterns.
However, traditional graph databases (aka “Label property graphs”) have serious limitations for big data analytics in automotive. They,
- Require creating another physical silo of duplicate data, resulting in prohibitively high infrastructure and analytics development costs and time.
- Are difficult to access and query data sets for data modeling, discovery, and analytics, involving resource-intensive effort to scale users and use cases.
- Are limited by a single, hard-coded schema and must be rebuilt for new use cases, severely inhibiting discovery-style analytics speed and agility and adding development cost.
By contrast, a knowledge graph brings a “knowledge toolkit” that enriches, amplifies, and scales graph as a data structure and graph as a data model.
Enterprise knowledge graphs work with your existing architecture by adding a semantic layer to a data lake (or warehouse or lakehouse such as Databricks) to turbocharge advanced analytics. Here’s what distinguishes a knowledge graph used for scaling advanced analytics:
- Graph-based virtualization to access large amounts of data across formats, domains, and sources and the ability to incorporate new data sources/sets as needed – without the need to copy or move the data, which saves on infrastructure costs and analytics development time.
- A rich semantic layer between the analytics consumption and data platform layer, representing explicit and inferred relationships from data, including the context of data and metadata and any data interrelationship.
- Data model development and reuse to create a semantic data model with business concepts, reuse and expand the data models to address new use cases, and write federated queries without requiring proprietary language.
- Intuitive search and discovery of data insights to search semantically with context and graphically visualize data relationships to uncover hidden patterns or unexpected insights in relationships and extend this workflow into popular BI tools such as Tableau.
- Designed for performing large graph-based work at scale, including processing massive semantic or RDF triples without storing data centrally and query performance, thereby improving data & analytics work productivity and time to market.
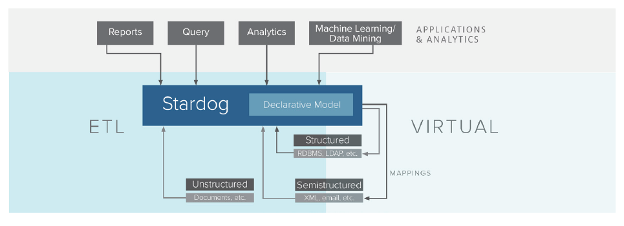
Stardog’s native semantic knowledge graph capabilities connect enterprise data based on meaning rather than location, enabling a connected network of business meaning independent of any silo, analytics, or application. Stardog knowledge graphs support modeling the enterprise and business rules with an expressive, extensible data model based on semantic graphs. And Stardog’s inference engine allows you to harmonize conflicting data definitions (without changing, moving, or even copying the underlying data) and intelligently apply these rules at search and at query time. And using a unique graph data virtualization capability, Stardog performs this on existing enterprise data where it lives, avoiding expensive or pointless data copying and data movement.
Real-world examples of big data analytics in automotive
BMW is building its business model on harnessing the power of data across design, engineering, production, sales, and customer support. Advanced analytics enables them to create accurate forecasts and proactively optimize processes, speeding up the continuous improvement of their production system in line.
General Motors has been the pioneer of advanced analytics in the automotive industry, with sensors and telematics within the car as its center of interest, making their cars more secure and reliable. For them, big data analytic insights from telematics have enabled a massive savings of up to $800 per car.
Mercedes-Benz Cars Operations 360 (MO360) is a new digital ecosystem, which uses real-time big data analytics to support Mercedes’ global vehicle production operations. Thanks to big data analytics, they are projecting to increase production efficiency by more than 15 percent by 2022**.**
Maruti Suzuki uses a “Market to One” approach as the big reason behind their award-winning customer retention. Through a 360-degree view of their more than ten million customers, they provide a personalized experience to each of its customers, which saw an overall growth of three percent in the first seven months after adopting this approach.
Getting started, now
An automaker’s competitive advantage is now largely determined by its ability to connect complex datasets, access sophisticated insights from the data, and make intelligent decisions based on both. According to Junghee Lee of Hyundai, “Through the big data analysis, we use optimization methodology to maximize the effectiveness of the utilization of our resources. There are many ways to utilize big data.”
And because knowledge graphs easily interoperate with data lakes (or data warehouses or data lakehouses) and business intelligence tools, they can rapidly infuse a rich and flexible semantic layer that dramatically increases data engineer and scientist productivity, improves data analytics speed, reduces integration costs, and boosts analytics insight to improve production, supply chain, and sales and marketing efforts, right now.
Further reading: Stardog-commissioned Forrester Consulting Total Economic Impact™ (TEI) study
